
Last updated:
Start With 3 Recruitment KPIs That Actually Drive Agency Growth

Recruitment Process

The Recruitify Team
Every recruitment agency should track eight core metrics: time-to-fill, fill rate, submission-to-hire ratio, offer acceptance rate, gross margin, days sales outstanding, cost per hire, and a quality-of-hire proxy. Review operational numbers like submittals and interviews weekly; review financial and strategic metrics like margin and DSO monthly or quarterly. New agencies should not chase all eight at once. Start with time-to-fill, fill rate, and gross margin, then expand once those three are stable.
TL;DR:
Agencies should initially focus on measuring time-to-fill, fill rate, and gross margin before expanding to other metrics, especially during early growth phases.
Time-to-fill averages around 9 days, but can be longer in technical or specialized roles, while top agencies fill over 70% of requisitions, far above the industry average.
Reviewing KPIs weekly for operational metrics and monthly or quarterly for financial results ensures timely response to issues and tracks structural health.
Disconnected systems cause significant reporting errors; integrated platforms like Recruitify streamline data collection, reduce errors, and improve KPI accuracy.
Leadership must define and own metric formulas and stage definitions to ensure consistent, reliable measurement and avoid misinterpretation of data.
RecruitifyBring Recruitment KPIs Into FocusRecruitify connects sales and recruitment workflows, helping IT agencies reduce information chaos and build more consistent operational reporting.See Recruitify in action
Table of Contents
What Are the Core Agency Recruitment KPIs and How Do You Calculate Them?
How Should You Structure Measurement Cadence and Data Ownership?
What Benchmarks Should You Use to Set Realistic Targets?
How Do You Choose the Right KPIs and Build a Starter Dashboard?
What Mistakes Quietly Wreck Recruitment KPI Data?
Where Does Automation Actually Close These Measurement Gaps?
Why KPI Discipline Comes Down to Leadership, Not Software
See How Unified Reporting Changes Your KPI Accuracy
Sources
FAQ
What Are the Core Agency Recruitment KPIs and How Do You Calculate Them?
The formulas below are not academic. Each one answers a question a client, a finance lead, or a recruiter will eventually ask you directly, and if you cannot answer it in one sentence, your reporting has a gap.
Time-to-fill measures the days between a job opening and an accepted offer. The formula is simple: Date offer accepted minus date requisition opened. Staffing agencies typically post a median of 9 days for this metric, with a range of 4 to 14 days depending on role complexity and vertical. If a client opens a requisition on March 1 and a candidate accepts on March 10, that’s a 9 day time-to-fill, right at the industry median.
Time-to-start picks up where time-to-fill ends. It measures days from requisition open to the candidate’s actual first day, which matters because notice periods and background checks can stretch a fast fill into a slow start. Industry data puts the median at 14 days, with a range of 10 to 24 days. A role that fills in 9 days but doesn’t start for another 15 has a real time-to-start of 24 days, and that gap is often invisible until a client asks why the seat is still empty.
Fill rate is the percentage of open requisitions your agency successfully closes: Positions filled divided by positions opened, times 100. The average across the industry sits around 45%, while top-performing agencies push past 70%. Closing 15 of those same 20 puts you in top-performer territory.
Submission-to-hire ratio tells you how well recruiters qualify candidates before submitting them to a client. The formula is Number of submittals divided by number of hires. A healthy industry ratio runs around 4 to 1, meaning four submitted candidates typically yield one hire. If your team is submitting 12 candidates per hire, that’s not a volume problem. It’s a qualification problem, and it usually means recruiters are submitting resumes to hit an activity quota instead of a fit standard.
Offer acceptance rate measures Offers accepted divided by offers extended, times 100.
Cost per hire adds up every recruiting expense and divides by total hires: Total recruiting costs divided by number of hires. That includes job board spend, sourcing tool licenses, recruiter time, and overhead. The calculation matters more than the number itself, because AI-driven screening tools can materially compress the cost side by cutting the hours recruiters spend manually reviewing resumes that were never going to be a match.
Gross margin is the number that actually pays your bills: (Client bill rate minus pay rate) divided by bill rate, times 100. This is the KPI that separates agencies that look busy from agencies that are profitable.
DSO (days sales outstanding) measures how fast you collect on invoices: (Accounts receivable divided by total credit sales) times number of days in the period. Healthy agencies run 45 to 55 days, and top-quartile agencies collect in under 35 days.
Redeployment rate tracks how many contractors you place into a new assignment after their current one ends, calculated as contractors redeployed divided by contractors ending assignments. A staffing desk with strong redeployment discipline turns a bench liability into recurring revenue instead of losing that candidate relationship entirely.
Candidate and hiring-manager NPS asks a single question on a 0 to 10 scale (“How likely are you to recommend this experience?”) and nets promoters against detractors. It’s a leading signal for quality-of-hire long before turnover data confirms or denies it.
KPI | Formula | Benchmark |
|---|---|---|
Time-to-fill | Offer accepted date minus requisition open date | Median 9 days |
Time-to-start | First day minus requisition open date | Median 14 days |
Fill rate | Positions filled ÷ positions opened × 100 | ~45% average, 70%+ top performers |
Submission-to-hire | Submittals ÷ hires | ~4:1 |
DSO | (AR ÷ credit sales) × days in period | 45 to 55 days |
One distinction trips up more agencies than any formula on this list: time-to-fill measures from job opening to accepted offer, while time-to-hire measures from the moment a candidate enters your funnel to their acceptance. Use time-to-fill when a client asks “how fast can you deliver on this role.” Use time-to-hire when you’re diagnosing your own sourcing pipeline, because it isolates how long candidates sit in your process regardless of when the requisition landed.
How Should You Structure Measurement Cadence and Data Ownership?
Not every KPI deserves the same attention frequency, and treating a lagging financial metric like a daily operational number just creates noise nobody acts on.
The clearest way to organize cadence is by splitting KPIs into leading and lagging indicators. Leading indicators, like submittal volume and interviews scheduled, predict outcomes before they happen. Lagging indicators, like fill rate and gross margin, confirm what already occurred. A complete KPI program pairs both, reviewing leading indicators weekly and lagging indicators monthly or quarterly.
Weekly review: submittals per recruiter, interviews scheduled, time-to-shortlist, and open requisition aging. These move fast enough that a week’s delay in noticing a problem means a week of lost placements.
Monthly review: fill rate, cost per hire, offer acceptance rate, and redeployment rate. These need enough volume to be statistically meaningful, so weekly snapshots tend to be noisy.
Quarterly review: gross margin trends, DSO, client retention, and NPS. These reflect structural health rather than any single week’s activity.
Data hygiene determines whether any of this is trustworthy. Every recruiter needs to log activity against the same stage labels, in the same system, at the same moment an event happens, not retroactively at the end of the week. A “submitted” stage that means one thing to one recruiter and something else to another makes your fill rate meaningless. Your ATS should own candidate stage data, your CRM should own client and requisition data, and your finance system should own invoicing and DSO. When those three systems don’t talk to each other, someone ends up rebuilding the numbers in a spreadsheet, and that’s where errors creep in.
Pro Tip: Set a timestamp rule that every stage change gets logged the same day it happens, not the same week. A single delayed update can shift your time-to-fill by several days and quietly corrupt a month of reporting.
What Benchmarks Should You Use to Set Realistic Targets?
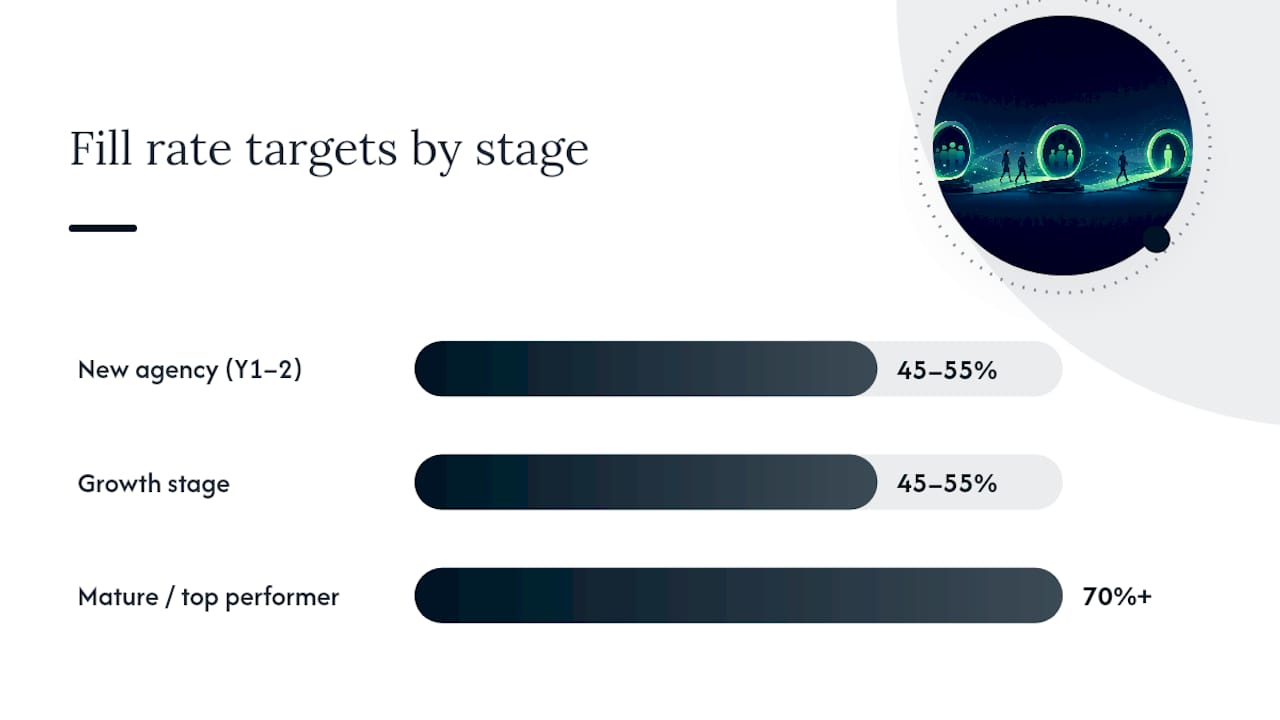
Generic industry averages are a starting point, not a ceiling. An agency working technology roles in a tight talent market will see different numbers than one placing light industrial staff on high-volume contracts, and your targets should reflect that difference rather than a single blended number.
Time-to-fill benchmarks illustrate this well. The 9-day median applies broadly, but a specialized technical search with a narrow candidate pool routinely runs longer, while high-volume light industrial roles can close faster.
Top-performing staffing agencies fill more than 70% of their open requisitions, compared to an industry average of roughly 45%. That gap represents the single clearest signal of operational maturity in this business.
Here’s how to translate broad benchmarks into targets by agency stage:
Agency stage | Time-to-fill target | Fill rate target | DSO target |
|---|---|---|---|
New agency (year 1-2) | Match or beat 9-day median | 45% to 55% | Under 55 days |
Growth stage | 9 to 14 days | 45% to 55% | 45 days |
Mature/top performer | 9 days | 70%+ | Under 35 days |
Convert these into weekly and monthly targets rather than letting them sit as abstract annual goals.
How Do You Choose the Right KPIs and Build a Starter Dashboard?
Most agencies fail at KPI selection not because they pick bad metrics, but because they pick too many at once. A three-step filter fixes this.
Define the business outcome first. Do you need more placements, higher margin, or faster cash collection? Each answer points to a different starting KPI.
Choose one leading indicator for that outcome. If the outcome is more placements, submittal volume and time-to-shortlist are your leading signals. If it’s margin, track bill-to-pay spread on every new deal as it’s negotiated, not after the invoice goes out.
Verify you can actually measure it today. A KPI you can’t pull cleanly from your ATS or CRM isn’t a KPI yet. It’s a wish list item.
New agencies should build a starter pack around time-to-fill, fill rate, and gross margin before adding anything else. Once those three run smoothly for a full quarter, expand into an operations pack: submission-to-hire ratio, offer acceptance rate, DSO, and redeployment rate.
A usable dashboard needs four fields on every widget: the metric name, a filter (by recruiter, client, or vertical), a comparison period (this week versus last week, this quarter versus last), and an owner responsible for acting on it. A recruiter-level view should show submittals and time-to-shortlist. A team-lead view should show fill rate and offer acceptance by desk. A finance view should show gross margin and DSO trends, ideally pulled straight from sales reporting tools that already connect to invoicing data instead of a rebuilt spreadsheet.
What Mistakes Quietly Wreck Recruitment KPI Data?
Three mistakes account for most of the bad reporting agencies bring to leadership meetings.
Inconsistent stage definitions. If one recruiter marks a candidate “submitted” at resume send and another marks it at client review, your submission-to-hire ratio is comparing apples to oranges. Fix this with a written stage map that gives a concrete example for every stage, not just a label.
Overvaluing volume metrics. Rewarding submittal count without a quality gate produces exactly the outcome you’d expect: recruiters flood clients with marginal candidates to hit a number. Pair every volume metric with a quality-of-hire proxy, like first-year attrition or hiring manager satisfaction, before you use it in a performance review.
Loose accounts receivable discipline. Late invoicing quietly wrecks cash flow long before anyone notices in the margin numbers. Monitor DSO monthly and tighten billing controls, like same-week invoice generation, the moment it drifts above your target.
Pro Tip: Run a quarterly audit where you pull ten random candidate records and trace every timestamp by hand. If the stage dates don’t match what actually happened, your dashboard is reporting fiction, not fact.
Where Does Automation Actually Close These Measurement Gaps?
Most of the data problems above trace back to one root cause: information moving between disconnected systems. A candidate gets sourced in one tool, tracked in another, and billed in a third, and every handoff between them is a chance for a timestamp to go stale or a stage label to get misapplied.

Recruitify was built around collapsing those handoffs into a single operational record. When an ATS, a sales CRM, and a contracting module share one database instead of three, a candidate’s stage change updates the same record that feeds your billing and your reporting, so there’s no reconciliation step where numbers drift apart. Recruitify’s own positioning claims a 70% reduction in administrative tasks when workflows from lead contact through contract generation run on one connected system, which shortens the distance between an event happening and that event showing up correctly in a report.
A few specific features address the exact gaps this article has covered:
The AI CV parser extracts structured candidate data from PDFs, scans, and photos in seconds, which removes manual data entry as a source of timestamp and stage errors.
Contextual matching scores candidates against project requirements automatically, giving you a cleaner submission-to-hire ratio because fewer marginal candidates reach the submitted stage in the first place.
GDPR audit trails log every record change, which means a stage timestamp has documented proof behind it instead of a recruiter’s memory of when something happened.
Why KPI Discipline Comes Down to Leadership, Not Software
The most common failure in recruitment KPI programs isn’t a missing metric. It’s leadership that never actually defines what a metric means before asking recruiters to hit it. If “time-to-fill” means something different to your finance team than it does to your recruiting managers, every scorecard built on top of that number is unreliable before anyone even looks at it.
Ownership has to sit with leadership, not with whoever happens to build the spreadsheet. Define each metric’s formula and stage boundaries once, in writing, and revisit them only when the business genuinely changes, not every time a number looks unflattering. Start with the three fundamentals rather than a twelve-metric dashboard nobody reviews consistently, and let automation carry the burden of capturing timestamps accurately so weekly reviews focus on decisions instead of data archaeology. Incentives matter here too: if recruiters are rewarded on submittal volume while the agency talks about quality-of-hire, don’t be surprised when volume wins. Transparent dashboards that every recruiter can see, not just leadership, tend to keep everyone honest about which numbers are real.
- Recruitify Team
See How Unified Reporting Changes Your KPI Accuracy
Some platforms give agency managers one place to watch time-to-fill, gross margin, and DSO move in real time, instead of reconciling three disconnected systems every Friday afternoon.
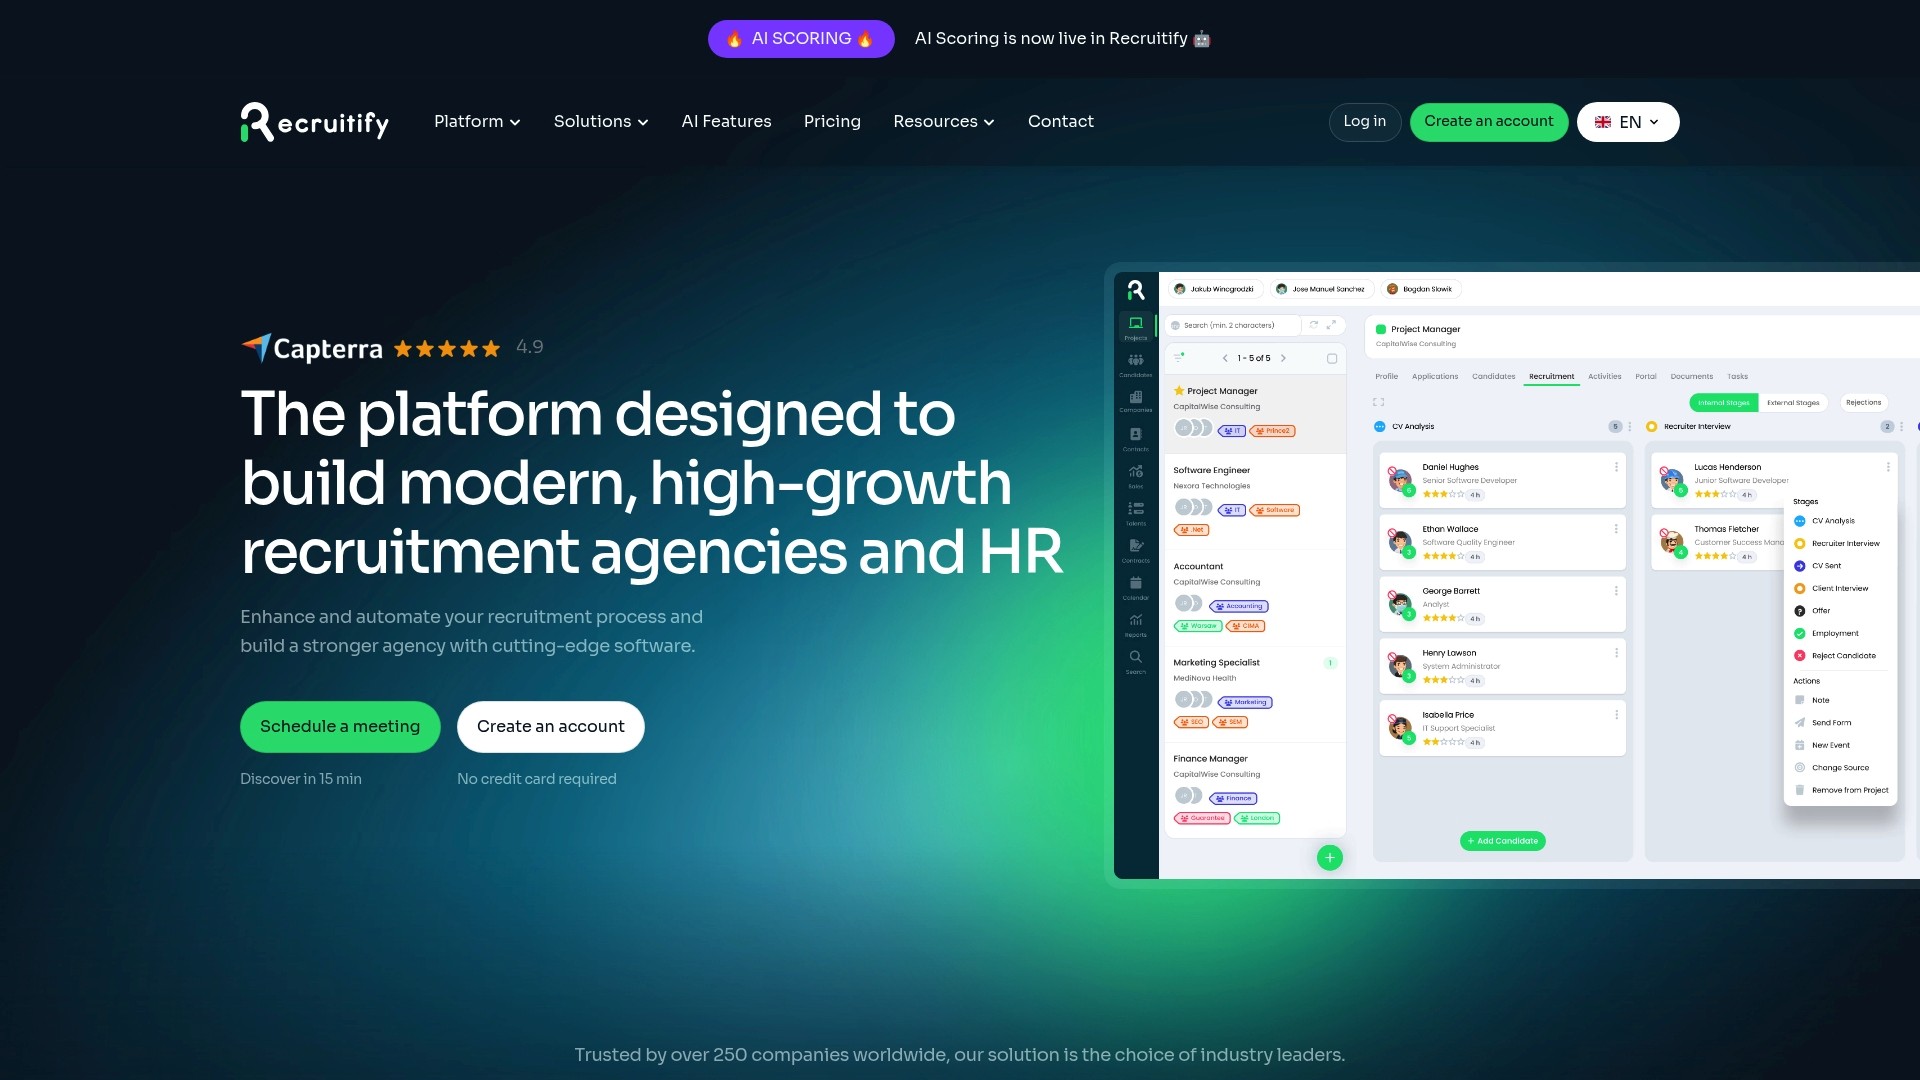
The gap between a spreadsheet-based KPI program and an automated one usually isn’t the formulas, it’s the lag between an event happening and that event appearing correctly in a report. Recruitify’s automation features close that lag by keeping candidate, client, and contract data in one system, so a stage change updates your dashboard the same moment it happens rather than after a manual export. Agencies running high placement volume can also pull margin and revenue trends directly from integrated sales reporting instead of rebuilding them in a separate finance tool. If your current reporting takes longer to assemble than it does to act on, request a demo of Recruitify’s recruiting project management tools and see what a single connected pipeline looks like on your own requisitions.
Sources
FAQ
What Are Good KPIs for Recruiters?
Individual recruiters should be measured on submittals per week, time-to-shortlist, submission-to-hire ratio, and offer acceptance rate, since these are the leading indicators they directly control.
What Are the 5 C’s of Recruitment?
Definitions vary across sources, but a common version covers candidate experience, communication, competency, culture fit, and cost, framing recruitment quality beyond just speed or volume.
What Are the 5 Main KPIs for a Recruitment Agency?
The five most commonly tracked are time-to-fill, fill rate, gross margin, submission-to-hire ratio, and DSO, since together they cover speed, effectiveness, profitability, and cash health.
What Are the Four P’s of Recruitment?
The four P’s typically refer to people, process, performance, and profit, a framework for thinking about recruitment operations holistically rather than a specific numeric standard.
How Often Should Agencies Review Recruitment KPIs?
Review operational KPIs like submittals and interviews weekly, and review financial or strategic KPIs like gross margin, DSO, and client retention monthly or quarterly.
Can Automation Improve Recruitment KPI Accuracy?
Yes. Platforms like Recruitify that consolidate ATS, CRM, and contracting data into one system reduce the handoffs where stage timestamps and billing data typically go stale or get misrecorded.
Recommended


News & Updates
Stay up-to-date with the latest innovations, features, and tips about Recruitify!
By providing your email address within the newsletter sign-up form, you confirm its processing to send marketing information regarding the Administrator’s products and services. The Administrator of your personal data processed for the abovementioned purposes is Recruitify Spółka z o.o., based in Warsaw, Poland (KRS 0000709889). For more information on the principles of personal data processing and the rights of data subjects, please check the Privacy Policy.

Last updated:
Start With 3 Recruitment KPIs That Actually Drive Agency Growth
Recruitment Process
The Recruitify Team
Every recruitment agency should track eight core metrics: time-to-fill, fill rate, submission-to-hire ratio, offer acceptance rate, gross margin, days sales outstanding, cost per hire, and a quality-of-hire proxy. Review operational numbers like submittals and interviews weekly; review financial and strategic metrics like margin and DSO monthly or quarterly. New agencies should not chase all eight at once. Start with time-to-fill, fill rate, and gross margin, then expand once those three are stable.
TL;DR:
Agencies should initially focus on measuring time-to-fill, fill rate, and gross margin before expanding to other metrics, especially during early growth phases.
Time-to-fill averages around 9 days, but can be longer in technical or specialized roles, while top agencies fill over 70% of requisitions, far above the industry average.
Reviewing KPIs weekly for operational metrics and monthly or quarterly for financial results ensures timely response to issues and tracks structural health.
Disconnected systems cause significant reporting errors; integrated platforms like Recruitify streamline data collection, reduce errors, and improve KPI accuracy.
Leadership must define and own metric formulas and stage definitions to ensure consistent, reliable measurement and avoid misinterpretation of data.
RecruitifyBring Recruitment KPIs Into FocusRecruitify connects sales and recruitment workflows, helping IT agencies reduce information chaos and build more consistent operational reporting.See Recruitify in action
Table of Contents
What Are the Core Agency Recruitment KPIs and How Do You Calculate Them?
How Should You Structure Measurement Cadence and Data Ownership?
What Benchmarks Should You Use to Set Realistic Targets?
How Do You Choose the Right KPIs and Build a Starter Dashboard?
What Mistakes Quietly Wreck Recruitment KPI Data?
Where Does Automation Actually Close These Measurement Gaps?
Why KPI Discipline Comes Down to Leadership, Not Software
See How Unified Reporting Changes Your KPI Accuracy
Sources
FAQ
What Are the Core Agency Recruitment KPIs and How Do You Calculate Them?
The formulas below are not academic. Each one answers a question a client, a finance lead, or a recruiter will eventually ask you directly, and if you cannot answer it in one sentence, your reporting has a gap.
Time-to-fill measures the days between a job opening and an accepted offer. The formula is simple: Date offer accepted minus date requisition opened. Staffing agencies typically post a median of 9 days for this metric, with a range of 4 to 14 days depending on role complexity and vertical. If a client opens a requisition on March 1 and a candidate accepts on March 10, that’s a 9 day time-to-fill, right at the industry median.
Time-to-start picks up where time-to-fill ends. It measures days from requisition open to the candidate’s actual first day, which matters because notice periods and background checks can stretch a fast fill into a slow start. Industry data puts the median at 14 days, with a range of 10 to 24 days. A role that fills in 9 days but doesn’t start for another 15 has a real time-to-start of 24 days, and that gap is often invisible until a client asks why the seat is still empty.
Fill rate is the percentage of open requisitions your agency successfully closes: Positions filled divided by positions opened, times 100. The average across the industry sits around 45%, while top-performing agencies push past 70%. Closing 15 of those same 20 puts you in top-performer territory.
Submission-to-hire ratio tells you how well recruiters qualify candidates before submitting them to a client. The formula is Number of submittals divided by number of hires. A healthy industry ratio runs around 4 to 1, meaning four submitted candidates typically yield one hire. If your team is submitting 12 candidates per hire, that’s not a volume problem. It’s a qualification problem, and it usually means recruiters are submitting resumes to hit an activity quota instead of a fit standard.
Offer acceptance rate measures Offers accepted divided by offers extended, times 100.
Cost per hire adds up every recruiting expense and divides by total hires: Total recruiting costs divided by number of hires. That includes job board spend, sourcing tool licenses, recruiter time, and overhead. The calculation matters more than the number itself, because AI-driven screening tools can materially compress the cost side by cutting the hours recruiters spend manually reviewing resumes that were never going to be a match.
Gross margin is the number that actually pays your bills: (Client bill rate minus pay rate) divided by bill rate, times 100. This is the KPI that separates agencies that look busy from agencies that are profitable.
DSO (days sales outstanding) measures how fast you collect on invoices: (Accounts receivable divided by total credit sales) times number of days in the period. Healthy agencies run 45 to 55 days, and top-quartile agencies collect in under 35 days.
Redeployment rate tracks how many contractors you place into a new assignment after their current one ends, calculated as contractors redeployed divided by contractors ending assignments. A staffing desk with strong redeployment discipline turns a bench liability into recurring revenue instead of losing that candidate relationship entirely.
Candidate and hiring-manager NPS asks a single question on a 0 to 10 scale (“How likely are you to recommend this experience?”) and nets promoters against detractors. It’s a leading signal for quality-of-hire long before turnover data confirms or denies it.
KPI | Formula | Benchmark |
|---|---|---|
Time-to-fill | Offer accepted date minus requisition open date | Median 9 days |
Time-to-start | First day minus requisition open date | Median 14 days |
Fill rate | Positions filled ÷ positions opened × 100 | ~45% average, 70%+ top performers |
Submission-to-hire | Submittals ÷ hires | ~4:1 |
DSO | (AR ÷ credit sales) × days in period | 45 to 55 days |
One distinction trips up more agencies than any formula on this list: time-to-fill measures from job opening to accepted offer, while time-to-hire measures from the moment a candidate enters your funnel to their acceptance. Use time-to-fill when a client asks “how fast can you deliver on this role.” Use time-to-hire when you’re diagnosing your own sourcing pipeline, because it isolates how long candidates sit in your process regardless of when the requisition landed.
How Should You Structure Measurement Cadence and Data Ownership?
Not every KPI deserves the same attention frequency, and treating a lagging financial metric like a daily operational number just creates noise nobody acts on.
The clearest way to organize cadence is by splitting KPIs into leading and lagging indicators. Leading indicators, like submittal volume and interviews scheduled, predict outcomes before they happen. Lagging indicators, like fill rate and gross margin, confirm what already occurred. A complete KPI program pairs both, reviewing leading indicators weekly and lagging indicators monthly or quarterly.
Weekly review: submittals per recruiter, interviews scheduled, time-to-shortlist, and open requisition aging. These move fast enough that a week’s delay in noticing a problem means a week of lost placements.
Monthly review: fill rate, cost per hire, offer acceptance rate, and redeployment rate. These need enough volume to be statistically meaningful, so weekly snapshots tend to be noisy.
Quarterly review: gross margin trends, DSO, client retention, and NPS. These reflect structural health rather than any single week’s activity.
Data hygiene determines whether any of this is trustworthy. Every recruiter needs to log activity against the same stage labels, in the same system, at the same moment an event happens, not retroactively at the end of the week. A “submitted” stage that means one thing to one recruiter and something else to another makes your fill rate meaningless. Your ATS should own candidate stage data, your CRM should own client and requisition data, and your finance system should own invoicing and DSO. When those three systems don’t talk to each other, someone ends up rebuilding the numbers in a spreadsheet, and that’s where errors creep in.
Pro Tip: Set a timestamp rule that every stage change gets logged the same day it happens, not the same week. A single delayed update can shift your time-to-fill by several days and quietly corrupt a month of reporting.
What Benchmarks Should You Use to Set Realistic Targets?
Generic industry averages are a starting point, not a ceiling. An agency working technology roles in a tight talent market will see different numbers than one placing light industrial staff on high-volume contracts, and your targets should reflect that difference rather than a single blended number.
Time-to-fill benchmarks illustrate this well. The 9-day median applies broadly, but a specialized technical search with a narrow candidate pool routinely runs longer, while high-volume light industrial roles can close faster.
Top-performing staffing agencies fill more than 70% of their open requisitions, compared to an industry average of roughly 45%. That gap represents the single clearest signal of operational maturity in this business.
Here’s how to translate broad benchmarks into targets by agency stage:
Agency stage | Time-to-fill target | Fill rate target | DSO target |
|---|---|---|---|
New agency (year 1-2) | Match or beat 9-day median | 45% to 55% | Under 55 days |
Growth stage | 9 to 14 days | 45% to 55% | 45 days |
Mature/top performer | 9 days | 70%+ | Under 35 days |
Convert these into weekly and monthly targets rather than letting them sit as abstract annual goals.
How Do You Choose the Right KPIs and Build a Starter Dashboard?
Most agencies fail at KPI selection not because they pick bad metrics, but because they pick too many at once. A three-step filter fixes this.
Define the business outcome first. Do you need more placements, higher margin, or faster cash collection? Each answer points to a different starting KPI.
Choose one leading indicator for that outcome. If the outcome is more placements, submittal volume and time-to-shortlist are your leading signals. If it’s margin, track bill-to-pay spread on every new deal as it’s negotiated, not after the invoice goes out.
Verify you can actually measure it today. A KPI you can’t pull cleanly from your ATS or CRM isn’t a KPI yet. It’s a wish list item.
New agencies should build a starter pack around time-to-fill, fill rate, and gross margin before adding anything else. Once those three run smoothly for a full quarter, expand into an operations pack: submission-to-hire ratio, offer acceptance rate, DSO, and redeployment rate.
A usable dashboard needs four fields on every widget: the metric name, a filter (by recruiter, client, or vertical), a comparison period (this week versus last week, this quarter versus last), and an owner responsible for acting on it. A recruiter-level view should show submittals and time-to-shortlist. A team-lead view should show fill rate and offer acceptance by desk. A finance view should show gross margin and DSO trends, ideally pulled straight from sales reporting tools that already connect to invoicing data instead of a rebuilt spreadsheet.
What Mistakes Quietly Wreck Recruitment KPI Data?
Three mistakes account for most of the bad reporting agencies bring to leadership meetings.
Inconsistent stage definitions. If one recruiter marks a candidate “submitted” at resume send and another marks it at client review, your submission-to-hire ratio is comparing apples to oranges. Fix this with a written stage map that gives a concrete example for every stage, not just a label.
Overvaluing volume metrics. Rewarding submittal count without a quality gate produces exactly the outcome you’d expect: recruiters flood clients with marginal candidates to hit a number. Pair every volume metric with a quality-of-hire proxy, like first-year attrition or hiring manager satisfaction, before you use it in a performance review.
Loose accounts receivable discipline. Late invoicing quietly wrecks cash flow long before anyone notices in the margin numbers. Monitor DSO monthly and tighten billing controls, like same-week invoice generation, the moment it drifts above your target.
Pro Tip: Run a quarterly audit where you pull ten random candidate records and trace every timestamp by hand. If the stage dates don’t match what actually happened, your dashboard is reporting fiction, not fact.
Where Does Automation Actually Close These Measurement Gaps?
Most of the data problems above trace back to one root cause: information moving between disconnected systems. A candidate gets sourced in one tool, tracked in another, and billed in a third, and every handoff between them is a chance for a timestamp to go stale or a stage label to get misapplied.
Recruitify was built around collapsing those handoffs into a single operational record. When an ATS, a sales CRM, and a contracting module share one database instead of three, a candidate’s stage change updates the same record that feeds your billing and your reporting, so there’s no reconciliation step where numbers drift apart. Recruitify’s own positioning claims a 70% reduction in administrative tasks when workflows from lead contact through contract generation run on one connected system, which shortens the distance between an event happening and that event showing up correctly in a report.
A few specific features address the exact gaps this article has covered:
The AI CV parser extracts structured candidate data from PDFs, scans, and photos in seconds, which removes manual data entry as a source of timestamp and stage errors.
Contextual matching scores candidates against project requirements automatically, giving you a cleaner submission-to-hire ratio because fewer marginal candidates reach the submitted stage in the first place.
GDPR audit trails log every record change, which means a stage timestamp has documented proof behind it instead of a recruiter’s memory of when something happened.
Why KPI Discipline Comes Down to Leadership, Not Software
The most common failure in recruitment KPI programs isn’t a missing metric. It’s leadership that never actually defines what a metric means before asking recruiters to hit it. If “time-to-fill” means something different to your finance team than it does to your recruiting managers, every scorecard built on top of that number is unreliable before anyone even looks at it.
Ownership has to sit with leadership, not with whoever happens to build the spreadsheet. Define each metric’s formula and stage boundaries once, in writing, and revisit them only when the business genuinely changes, not every time a number looks unflattering. Start with the three fundamentals rather than a twelve-metric dashboard nobody reviews consistently, and let automation carry the burden of capturing timestamps accurately so weekly reviews focus on decisions instead of data archaeology. Incentives matter here too: if recruiters are rewarded on submittal volume while the agency talks about quality-of-hire, don’t be surprised when volume wins. Transparent dashboards that every recruiter can see, not just leadership, tend to keep everyone honest about which numbers are real.
- Recruitify Team
See How Unified Reporting Changes Your KPI Accuracy
Some platforms give agency managers one place to watch time-to-fill, gross margin, and DSO move in real time, instead of reconciling three disconnected systems every Friday afternoon.
The gap between a spreadsheet-based KPI program and an automated one usually isn’t the formulas, it’s the lag between an event happening and that event appearing correctly in a report. Recruitify’s automation features close that lag by keeping candidate, client, and contract data in one system, so a stage change updates your dashboard the same moment it happens rather than after a manual export. Agencies running high placement volume can also pull margin and revenue trends directly from integrated sales reporting instead of rebuilding them in a separate finance tool. If your current reporting takes longer to assemble than it does to act on, request a demo of Recruitify’s recruiting project management tools and see what a single connected pipeline looks like on your own requisitions.
Sources
FAQ
What Are Good KPIs for Recruiters?
Individual recruiters should be measured on submittals per week, time-to-shortlist, submission-to-hire ratio, and offer acceptance rate, since these are the leading indicators they directly control.
What Are the 5 C’s of Recruitment?
Definitions vary across sources, but a common version covers candidate experience, communication, competency, culture fit, and cost, framing recruitment quality beyond just speed or volume.
What Are the 5 Main KPIs for a Recruitment Agency?
The five most commonly tracked are time-to-fill, fill rate, gross margin, submission-to-hire ratio, and DSO, since together they cover speed, effectiveness, profitability, and cash health.
What Are the Four P’s of Recruitment?
The four P’s typically refer to people, process, performance, and profit, a framework for thinking about recruitment operations holistically rather than a specific numeric standard.
How Often Should Agencies Review Recruitment KPIs?
Review operational KPIs like submittals and interviews weekly, and review financial or strategic KPIs like gross margin, DSO, and client retention monthly or quarterly.
Can Automation Improve Recruitment KPI Accuracy?
Yes. Platforms like Recruitify that consolidate ATS, CRM, and contracting data into one system reduce the handoffs where stage timestamps and billing data typically go stale or get misrecorded.
Recommended
News & Updates
Stay up-to-date with the latest innovations, features, and tips about Recruitify!
By providing your email address within the newsletter sign-up form, you confirm its processing to send marketing information regarding the Administrator’s products and services. The Administrator of your personal data processed for the abovementioned purposes is Recruitify Spółka z o.o., based in Warsaw, Poland (KRS 0000709889). For more information on the principles of personal data processing and the rights of data subjects, please check the Privacy Policy.
Last updated:
Start With 3 Recruitment KPIs That Actually Drive Agency Growth
Recruitment Process
The Recruitify Team
Every recruitment agency should track eight core metrics: time-to-fill, fill rate, submission-to-hire ratio, offer acceptance rate, gross margin, days sales outstanding, cost per hire, and a quality-of-hire proxy. Review operational numbers like submittals and interviews weekly; review financial and strategic metrics like margin and DSO monthly or quarterly. New agencies should not chase all eight at once. Start with time-to-fill, fill rate, and gross margin, then expand once those three are stable.
TL;DR:
Agencies should initially focus on measuring time-to-fill, fill rate, and gross margin before expanding to other metrics, especially during early growth phases.
Time-to-fill averages around 9 days, but can be longer in technical or specialized roles, while top agencies fill over 70% of requisitions, far above the industry average.
Reviewing KPIs weekly for operational metrics and monthly or quarterly for financial results ensures timely response to issues and tracks structural health.
Disconnected systems cause significant reporting errors; integrated platforms like Recruitify streamline data collection, reduce errors, and improve KPI accuracy.
Leadership must define and own metric formulas and stage definitions to ensure consistent, reliable measurement and avoid misinterpretation of data.
RecruitifyBring Recruitment KPIs Into FocusRecruitify connects sales and recruitment workflows, helping IT agencies reduce information chaos and build more consistent operational reporting.See Recruitify in action
Table of Contents
What Are the Core Agency Recruitment KPIs and How Do You Calculate Them?
How Should You Structure Measurement Cadence and Data Ownership?
What Benchmarks Should You Use to Set Realistic Targets?
How Do You Choose the Right KPIs and Build a Starter Dashboard?
What Mistakes Quietly Wreck Recruitment KPI Data?
Where Does Automation Actually Close These Measurement Gaps?
Why KPI Discipline Comes Down to Leadership, Not Software
See How Unified Reporting Changes Your KPI Accuracy
Sources
FAQ
What Are the Core Agency Recruitment KPIs and How Do You Calculate Them?
The formulas below are not academic. Each one answers a question a client, a finance lead, or a recruiter will eventually ask you directly, and if you cannot answer it in one sentence, your reporting has a gap.
Time-to-fill measures the days between a job opening and an accepted offer. The formula is simple: Date offer accepted minus date requisition opened. Staffing agencies typically post a median of 9 days for this metric, with a range of 4 to 14 days depending on role complexity and vertical. If a client opens a requisition on March 1 and a candidate accepts on March 10, that’s a 9 day time-to-fill, right at the industry median.
Time-to-start picks up where time-to-fill ends. It measures days from requisition open to the candidate’s actual first day, which matters because notice periods and background checks can stretch a fast fill into a slow start. Industry data puts the median at 14 days, with a range of 10 to 24 days. A role that fills in 9 days but doesn’t start for another 15 has a real time-to-start of 24 days, and that gap is often invisible until a client asks why the seat is still empty.
Fill rate is the percentage of open requisitions your agency successfully closes: Positions filled divided by positions opened, times 100. The average across the industry sits around 45%, while top-performing agencies push past 70%. Closing 15 of those same 20 puts you in top-performer territory.
Submission-to-hire ratio tells you how well recruiters qualify candidates before submitting them to a client. The formula is Number of submittals divided by number of hires. A healthy industry ratio runs around 4 to 1, meaning four submitted candidates typically yield one hire. If your team is submitting 12 candidates per hire, that’s not a volume problem. It’s a qualification problem, and it usually means recruiters are submitting resumes to hit an activity quota instead of a fit standard.
Offer acceptance rate measures Offers accepted divided by offers extended, times 100.
Cost per hire adds up every recruiting expense and divides by total hires: Total recruiting costs divided by number of hires. That includes job board spend, sourcing tool licenses, recruiter time, and overhead. The calculation matters more than the number itself, because AI-driven screening tools can materially compress the cost side by cutting the hours recruiters spend manually reviewing resumes that were never going to be a match.
Gross margin is the number that actually pays your bills: (Client bill rate minus pay rate) divided by bill rate, times 100. This is the KPI that separates agencies that look busy from agencies that are profitable.
DSO (days sales outstanding) measures how fast you collect on invoices: (Accounts receivable divided by total credit sales) times number of days in the period. Healthy agencies run 45 to 55 days, and top-quartile agencies collect in under 35 days.
Redeployment rate tracks how many contractors you place into a new assignment after their current one ends, calculated as contractors redeployed divided by contractors ending assignments. A staffing desk with strong redeployment discipline turns a bench liability into recurring revenue instead of losing that candidate relationship entirely.
Candidate and hiring-manager NPS asks a single question on a 0 to 10 scale (“How likely are you to recommend this experience?”) and nets promoters against detractors. It’s a leading signal for quality-of-hire long before turnover data confirms or denies it.
KPI | Formula | Benchmark |
|---|---|---|
Time-to-fill | Offer accepted date minus requisition open date | Median 9 days |
Time-to-start | First day minus requisition open date | Median 14 days |
Fill rate | Positions filled ÷ positions opened × 100 | ~45% average, 70%+ top performers |
Submission-to-hire | Submittals ÷ hires | ~4:1 |
DSO | (AR ÷ credit sales) × days in period | 45 to 55 days |
One distinction trips up more agencies than any formula on this list: time-to-fill measures from job opening to accepted offer, while time-to-hire measures from the moment a candidate enters your funnel to their acceptance. Use time-to-fill when a client asks “how fast can you deliver on this role.” Use time-to-hire when you’re diagnosing your own sourcing pipeline, because it isolates how long candidates sit in your process regardless of when the requisition landed.
How Should You Structure Measurement Cadence and Data Ownership?
Not every KPI deserves the same attention frequency, and treating a lagging financial metric like a daily operational number just creates noise nobody acts on.
The clearest way to organize cadence is by splitting KPIs into leading and lagging indicators. Leading indicators, like submittal volume and interviews scheduled, predict outcomes before they happen. Lagging indicators, like fill rate and gross margin, confirm what already occurred. A complete KPI program pairs both, reviewing leading indicators weekly and lagging indicators monthly or quarterly.
Weekly review: submittals per recruiter, interviews scheduled, time-to-shortlist, and open requisition aging. These move fast enough that a week’s delay in noticing a problem means a week of lost placements.
Monthly review: fill rate, cost per hire, offer acceptance rate, and redeployment rate. These need enough volume to be statistically meaningful, so weekly snapshots tend to be noisy.
Quarterly review: gross margin trends, DSO, client retention, and NPS. These reflect structural health rather than any single week’s activity.
Data hygiene determines whether any of this is trustworthy. Every recruiter needs to log activity against the same stage labels, in the same system, at the same moment an event happens, not retroactively at the end of the week. A “submitted” stage that means one thing to one recruiter and something else to another makes your fill rate meaningless. Your ATS should own candidate stage data, your CRM should own client and requisition data, and your finance system should own invoicing and DSO. When those three systems don’t talk to each other, someone ends up rebuilding the numbers in a spreadsheet, and that’s where errors creep in.
Pro Tip: Set a timestamp rule that every stage change gets logged the same day it happens, not the same week. A single delayed update can shift your time-to-fill by several days and quietly corrupt a month of reporting.
What Benchmarks Should You Use to Set Realistic Targets?
Generic industry averages are a starting point, not a ceiling. An agency working technology roles in a tight talent market will see different numbers than one placing light industrial staff on high-volume contracts, and your targets should reflect that difference rather than a single blended number.
Time-to-fill benchmarks illustrate this well. The 9-day median applies broadly, but a specialized technical search with a narrow candidate pool routinely runs longer, while high-volume light industrial roles can close faster.
Top-performing staffing agencies fill more than 70% of their open requisitions, compared to an industry average of roughly 45%. That gap represents the single clearest signal of operational maturity in this business.
Here’s how to translate broad benchmarks into targets by agency stage:
Agency stage | Time-to-fill target | Fill rate target | DSO target |
|---|---|---|---|
New agency (year 1-2) | Match or beat 9-day median | 45% to 55% | Under 55 days |
Growth stage | 9 to 14 days | 45% to 55% | 45 days |
Mature/top performer | 9 days | 70%+ | Under 35 days |
Convert these into weekly and monthly targets rather than letting them sit as abstract annual goals.
How Do You Choose the Right KPIs and Build a Starter Dashboard?
Most agencies fail at KPI selection not because they pick bad metrics, but because they pick too many at once. A three-step filter fixes this.
Define the business outcome first. Do you need more placements, higher margin, or faster cash collection? Each answer points to a different starting KPI.
Choose one leading indicator for that outcome. If the outcome is more placements, submittal volume and time-to-shortlist are your leading signals. If it’s margin, track bill-to-pay spread on every new deal as it’s negotiated, not after the invoice goes out.
Verify you can actually measure it today. A KPI you can’t pull cleanly from your ATS or CRM isn’t a KPI yet. It’s a wish list item.
New agencies should build a starter pack around time-to-fill, fill rate, and gross margin before adding anything else. Once those three run smoothly for a full quarter, expand into an operations pack: submission-to-hire ratio, offer acceptance rate, DSO, and redeployment rate.
A usable dashboard needs four fields on every widget: the metric name, a filter (by recruiter, client, or vertical), a comparison period (this week versus last week, this quarter versus last), and an owner responsible for acting on it. A recruiter-level view should show submittals and time-to-shortlist. A team-lead view should show fill rate and offer acceptance by desk. A finance view should show gross margin and DSO trends, ideally pulled straight from sales reporting tools that already connect to invoicing data instead of a rebuilt spreadsheet.
What Mistakes Quietly Wreck Recruitment KPI Data?
Three mistakes account for most of the bad reporting agencies bring to leadership meetings.
Inconsistent stage definitions. If one recruiter marks a candidate “submitted” at resume send and another marks it at client review, your submission-to-hire ratio is comparing apples to oranges. Fix this with a written stage map that gives a concrete example for every stage, not just a label.
Overvaluing volume metrics. Rewarding submittal count without a quality gate produces exactly the outcome you’d expect: recruiters flood clients with marginal candidates to hit a number. Pair every volume metric with a quality-of-hire proxy, like first-year attrition or hiring manager satisfaction, before you use it in a performance review.
Loose accounts receivable discipline. Late invoicing quietly wrecks cash flow long before anyone notices in the margin numbers. Monitor DSO monthly and tighten billing controls, like same-week invoice generation, the moment it drifts above your target.
Pro Tip: Run a quarterly audit where you pull ten random candidate records and trace every timestamp by hand. If the stage dates don’t match what actually happened, your dashboard is reporting fiction, not fact.
Where Does Automation Actually Close These Measurement Gaps?
Most of the data problems above trace back to one root cause: information moving between disconnected systems. A candidate gets sourced in one tool, tracked in another, and billed in a third, and every handoff between them is a chance for a timestamp to go stale or a stage label to get misapplied.
Recruitify was built around collapsing those handoffs into a single operational record. When an ATS, a sales CRM, and a contracting module share one database instead of three, a candidate’s stage change updates the same record that feeds your billing and your reporting, so there’s no reconciliation step where numbers drift apart. Recruitify’s own positioning claims a 70% reduction in administrative tasks when workflows from lead contact through contract generation run on one connected system, which shortens the distance between an event happening and that event showing up correctly in a report.
A few specific features address the exact gaps this article has covered:
The AI CV parser extracts structured candidate data from PDFs, scans, and photos in seconds, which removes manual data entry as a source of timestamp and stage errors.
Contextual matching scores candidates against project requirements automatically, giving you a cleaner submission-to-hire ratio because fewer marginal candidates reach the submitted stage in the first place.
GDPR audit trails log every record change, which means a stage timestamp has documented proof behind it instead of a recruiter’s memory of when something happened.
Why KPI Discipline Comes Down to Leadership, Not Software
The most common failure in recruitment KPI programs isn’t a missing metric. It’s leadership that never actually defines what a metric means before asking recruiters to hit it. If “time-to-fill” means something different to your finance team than it does to your recruiting managers, every scorecard built on top of that number is unreliable before anyone even looks at it.
Ownership has to sit with leadership, not with whoever happens to build the spreadsheet. Define each metric’s formula and stage boundaries once, in writing, and revisit them only when the business genuinely changes, not every time a number looks unflattering. Start with the three fundamentals rather than a twelve-metric dashboard nobody reviews consistently, and let automation carry the burden of capturing timestamps accurately so weekly reviews focus on decisions instead of data archaeology. Incentives matter here too: if recruiters are rewarded on submittal volume while the agency talks about quality-of-hire, don’t be surprised when volume wins. Transparent dashboards that every recruiter can see, not just leadership, tend to keep everyone honest about which numbers are real.
- Recruitify Team
See How Unified Reporting Changes Your KPI Accuracy
Some platforms give agency managers one place to watch time-to-fill, gross margin, and DSO move in real time, instead of reconciling three disconnected systems every Friday afternoon.
The gap between a spreadsheet-based KPI program and an automated one usually isn’t the formulas, it’s the lag between an event happening and that event appearing correctly in a report. Recruitify’s automation features close that lag by keeping candidate, client, and contract data in one system, so a stage change updates your dashboard the same moment it happens rather than after a manual export. Agencies running high placement volume can also pull margin and revenue trends directly from integrated sales reporting instead of rebuilding them in a separate finance tool. If your current reporting takes longer to assemble than it does to act on, request a demo of Recruitify’s recruiting project management tools and see what a single connected pipeline looks like on your own requisitions.
Sources
FAQ
What Are Good KPIs for Recruiters?
Individual recruiters should be measured on submittals per week, time-to-shortlist, submission-to-hire ratio, and offer acceptance rate, since these are the leading indicators they directly control.
What Are the 5 C’s of Recruitment?
Definitions vary across sources, but a common version covers candidate experience, communication, competency, culture fit, and cost, framing recruitment quality beyond just speed or volume.
What Are the 5 Main KPIs for a Recruitment Agency?
The five most commonly tracked are time-to-fill, fill rate, gross margin, submission-to-hire ratio, and DSO, since together they cover speed, effectiveness, profitability, and cash health.
What Are the Four P’s of Recruitment?
The four P’s typically refer to people, process, performance, and profit, a framework for thinking about recruitment operations holistically rather than a specific numeric standard.
How Often Should Agencies Review Recruitment KPIs?
Review operational KPIs like submittals and interviews weekly, and review financial or strategic KPIs like gross margin, DSO, and client retention monthly or quarterly.
Can Automation Improve Recruitment KPI Accuracy?
Yes. Platforms like Recruitify that consolidate ATS, CRM, and contracting data into one system reduce the handoffs where stage timestamps and billing data typically go stale or get misrecorded.
Recommended
News & Updates
Stay up-to-date with the latest innovations, features, and tips about Recruitify!
By providing your email address within the newsletter sign-up form, you confirm its processing to send marketing information regarding the Administrator’s products and services. The Administrator of your personal data processed for the abovementioned purposes is Recruitify Spółka z o.o., based in Warsaw, Poland (KRS 0000709889). For more information on the principles of personal data processing and the rights of data subjects, please check the Privacy Policy.

Discover More

Recruitment Process
90 Day Recruitment Marketing Strategy With Funnel Math for Recruiters
For recruiters: build always on pipelines with role level funnel math, a 3–5 KPI scorecard, and automation to cut admin.
11 Sept 2026
Discover More

Acquiring Talent
8 Applicant Tracking System Features HR Leaders Must Prioritize
A practitioner-focused breakdown of the eight core applicant tracking system features HR leaders and recruiters should prioritize to speed hiring, improve...
10 Sept 2026
Discover More

Applicant Tracking System
Hit 80+ Scores: Automated Resume Screening for HR & Job Seekers
Learn resume formatting fixes that raise ATS scores above 80, plus recruiter steps for calibration, bias audits, and defensible, fair screening workflows.
9 Sept 2026
Discover More
Recruitment Process
90 Day Recruitment Marketing Strategy With Funnel Math for Recruiters
For recruiters: build always on pipelines with role level funnel math, a 3–5 KPI scorecard, and automation to cut admin.
11 Sept 2026
Discover More
Acquiring Talent
8 Applicant Tracking System Features HR Leaders Must Prioritize
A practitioner-focused breakdown of the eight core applicant tracking system features HR leaders and recruiters should prioritize to speed hiring, improve...
10 Sept 2026
Discover More