🔥
Contracting
Explore the new contractor management module
🔥
Contracting
Explore the new contractor management module
🔥
Contracting
Explore the new contractor management module
🔥
Contracting
Explore the new contractor management module

Last updated:
Fix Funnel Bias Weekly: 10 Diversity Hiring Metrics for Recruiters

Innovations

The Recruitify Team
Fix Funnel Bias Weekly: 10 Diversity Hiring Metrics for Recruiters
Track seven metric groups, starting this week: funnel pass-through by cohort, time-to-hire and time-to-offer, offer acceptance, 30/90-day retention, candidate experience pulse, source mix, and structured-interview integrity. Review pass-through weekly with one designated owner, roll numbers up for hiring managers monthly, and summarize trends for leadership quarterly. Any segment under roughly 30 hires needs aggregation before you report it publicly.
TL;DR:
Tracking candidate outcomes like pass-through and offer acceptance rates by cohort reveals bias points and guides targeted process improvements.
Using at least 30 candidates per demographic segment before reporting ensures statistical reliability and protects individual privacy.
Regularly measuring time-to-offer and retention by group identifies delays and onboarding issues that impact diversity retention.
Standardizing screening with scored rubrics and calibrating interview panels help eliminate filtering bias across different candidate pools.
Automating data collection through platforms like Recruitify enables timely, accurate analysis and facilitates continuous, small adjustments to improve fairness.
Table of Contents
What Are Diversity Hiring Metrics, and Why Do They Matter?
The 10 Metrics Every Recruiting Team Should Track First
How to Measure Reliably: Sample Size, Segmentation, and Privacy
Diagnosing Bottlenecks: Turning a Metric Signal Into an Action
Building the Dashboard: Tiles, Views, and Reporting Cadence
Common Pitfalls That Undermine Diversity Hiring Data
Running a 3-Month Pilot With Recruitify
Measurement Is a Habit, Not a Report
See These Metrics Run Themselves in Recruitify
Sources
What Are Diversity Hiring Metrics, and Why Do They Matter?
Diversity hiring metrics are the data points that show whether your recruiting process treats candidates from different demographic groups fairly at every stage, from application through onboarding. That definition matters because most companies still measure the wrong thing: how many people from underrepresented groups they hired, rather than what happened to those candidates while they moved through the pipeline.
The business case is not abstract. Harvard Business Review’s analysis of failed diversity programs found that initiatives without structured measurement and linked process changes rarely produce lasting improvement. Programs that track outcomes and adjust the hiring process based on what the data shows tend to stick. Programs that run training sessions and hope for the best tend to fade within a year or two.
This is where the distinction between activity metrics and outcome metrics earns its keep. Activity metrics count effort: job fairs attended, LinkedIn posts published, resumes collected. Outcome metrics count results: who got screened, who got interviewed, who got an offer, and who accepted it. SHRM’s guidance on inclusion measurement leans hard on outcomes for a simple reason: activity can look busy while doing nothing to change who actually gets hired.
A useful gut check, before you build a dashboard:
Does this metric tell you what happened to a candidate, or just what your team did?
Can you segment it by demographic group without exposing individuals?
Would a hiring manager change their behavior if this number moved?
Recruitify’s own analytics layer is built around that third question, because a metric nobody acts on is just decoration.
The 10 Metrics Every Recruiting Team Should Track First
Instrumenting everything at once guarantees you’ll act on nothing. Start with these ten, in roughly this order of impact.
Applicant pool ratio. Numerator: applicants from a given demographic group; denominator: total applicants for the role. This tells you whether your top of funnel is broad enough before you even look at bias downstream. If the ratio badly trails your local labor market, the fix usually lives in sourcing channels and job description language, not in the screening step.
Screening pass-through rate. Numerator: candidates who clear resume/application screening from a cohort; denominator: applicants from that cohort. A gap here, especially one that dips below the four-fifths rule threshold used in U.S. adverse-impact analysis, points to screening criteria or rubric drift. Fix: standardize the screen with a scored rubric instead of a gut-check yes/no.
Interviewed diversity mix. Share of interview slots that go to candidates from each cohort, relative to their share of the screened pool. When this number drops between screening and interview, someone is quietly filtering people out before the panel ever sees them.
Interview-to-offer ratio. Numerator: offers extended from a cohort; denominator: candidates from that cohort who interviewed. This is where interviewer calibration issues show up. If one group consistently interviews well but doesn’t convert to offers, panel composition or unscored interview questions are the likely culprits.
Offer acceptance rate by cohort. Numerator: offers accepted; denominator: offers extended, split by group. Low acceptance in one cohort despite comparable offers elsewhere often signals a compensation gap, a slow process that lost the candidate to a competitor, or a weak candidate experience during final stages.
Time-to-first-interview and time-to-offer, segmented by group. If candidates from one cohort wait noticeably longer to hear back, that delay alone can explain lower acceptance rates. Measure the median, not the average, since a handful of stalled requisitions will otherwise skew the number.
30-day and 90-day retention by cohort. Retention gaps in the first quarter usually trace back to onboarding quality or a hiring process that oversold the role. This is the metric that tells you whether your funnel improvements are actually producing durable hires or just different-looking short-term ones.
Candidate experience pulse by demographic. A short post-interview or post-offer survey, broken out by group, catches friction that funnel numbers miss entirely, things like a panel that felt hostile or a process that felt confusing.
Source mix and pass-through by channel. Track which sourcing channels bring in diverse applicants and, separately, which channels’ candidates actually survive screening. A channel that brings volume but zero pass-through is wasting budget, not building pipeline.
Structured interview utilization and panel diversity. What share of interviews used a scored rubric versus an unscored conversation, and how diverse were the panels themselves. Sapia treats this as a leading indicator: teams that raise rubric usage tend to see pass-through gaps close within a quarter.
How to Measure Reliably: Sample Size, Segmentation, and Privacy
Your data sources are almost certainly already in place: your ATS for stage moves and dispositions, your interview scheduling or video platform for panel composition, your HRIS for post-hire retention, and a short pulse survey tool for experience data. The work is connecting them, not buying new ones.
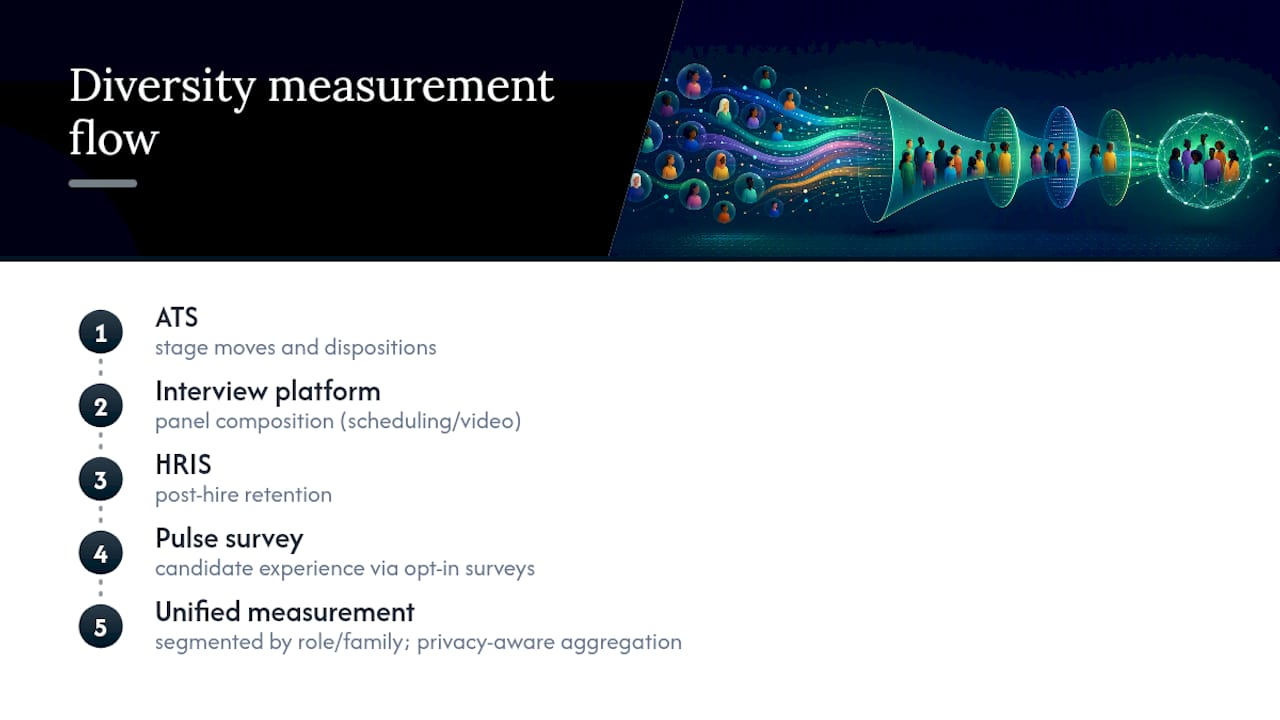
Segment at the role-family and level, not just company-wide. An enterprise-wide pass-through number can hide a real problem in engineering hiring while sales looks fine, and vice versa. NextMantra’s practical measurement guide recommends measuring at the decision level, meaning the role, family, or hiring manager, because that’s the level where an actual intervention can be made.
Sample size is the part teams get wrong most often. A cohort of eight applicants does not support a meaningful pass-through percentage; a single hire or rejection swings the number by 12 points. For small hiring volumes, aggregate across 12 to 24 months or combine similar roles before drawing conclusions, and benchmark externally against EEOC EEO-1 employment data rather than publishing a tiny internal split that looks precise but isn’t.
Pro Tip: If a demographic segment has fewer than 30 candidates in a quarter, don’t report a percentage at all. Report the raw count and let the trend build over two or three quarters before you act on it.
Privacy is not optional overhead here, it’s what makes the data trustworthy enough to use. Self-identification data should be collected through opt-in surveys with a clear opt-out, stored separately from resume and interview data, and reported only in aggregate with automatic suppression below your minimum threshold. Cross-border teams need extra caution: several countries restrict collecting race or ethnicity data entirely, so a global dashboard needs country-aware rules, not a single template.
Diagnosing Bottlenecks: Turning a Metric Signal Into an Action
Every recurring pattern in your funnel data points to a specific, fixable cause. The trick is resisting the urge to fix everything at once.
Low screening pass-through for one cohort usually means unscored screening criteria or a rubric that quietly favors a specific background. Fix: introduce blind or structured screening with a scored checklist.
Strong interviews but weak offer conversion points to panel calibration issues or informal decision-making after the interview. Fix: standardize interview scoring and require written justification for any hire/no-hire call.
Healthy applicant pool but thin diversity in interviews suggests filtering happens earlier than anyone admits. Fix: audit who screens resumes and whether they’re using the same rubric as everyone else.
Low offer acceptance in one cohort despite comparable offers often traces to a slow process or a compensation gap. Fix: benchmark time-to-offer and pay bands by cohort before assuming it’s a candidate preference issue.
Broad top-of-funnel diversity but narrow source pass-through means a channel is bringing volume without quality. Fix: reallocate sourcing spend toward channels with proven pass-through, not just raw applicant count.
Pro Tip: Run one change, with one accountable owner, for one week, then measure the effect before layering on a second change. Stacking three fixes at once makes it impossible to know which one actually moved the number.
Building the Dashboard: Tiles, Views, and Reporting Cadence
A dashboard that tries to serve everyone ends up serving no one. Build three distinct views instead of one crowded screen.
Recruiter view (weekly): funnel pass-through by stage and cohort, time-to-first-interview, and source mix. This is the working board, checked every week by the metric owner.
Hiring manager view (monthly): interview-to-offer ratio, offer acceptance, and structured-interview utilization for their open roles. Recruitment analytics guidance points out that automating this collection through your ATS removes the manual reporting lag that kills monthly reviews.
Leadership view (quarterly): trend lines on retention, aggregate pass-through, and source effectiveness, always shown with the sample size behind each number.
Set escalation thresholds in advance: a pass-through gap that persists for two consecutive reporting periods, not just one bad month, should trigger a review. And every leadership tile showing a percentage needs the underlying count next to it, so a 20-point swing on nine candidates doesn’t get treated the same as a 20-point swing on 400.
View | Cadence | Primary tiles |
|---|---|---|
Recruiter | Weekly | Pass-through by stage, time-to-interview, source mix |
Hiring manager | Monthly | Interview-to-offer, offer acceptance, rubric usage |
Leadership | Quarterly | Retention trends, aggregate pass-through, sample sizes |
Common Pitfalls That Undermine Diversity Hiring Data
Measurement programs fail in predictable ways, and most of the damage is self-inflicted.
Tracking headcount alone tells you nothing about fairness in the process that produced it.
Over-indexing on activity metrics (job fairs, impressions, applications) creates the appearance of progress without changing outcomes.
Publicizing tiny counts as precise percentages erodes trust the moment someone does the math and realizes it’s four people.
Treating metrics as quotas rather than diagnostic tools invites the exact legal and cultural backlash measurement was supposed to prevent.
This quarter, stop reporting any percentage built on fewer than 30 candidates, and start sharing pass-through trends with employee resource groups before you share them with leadership. Transparency with the people the data is about builds more trust than a polished slide deck ever will.
Running a 3-Month Pilot With Recruitify
Manually pulling stage-move data out of spreadsheets is the single biggest reason diversity metric programs stall before month two. Recruitify’s platform captures every stage transition, disposition, and interview score automatically, so pass-through calculations update themselves instead of waiting for someone to compile a report.
A workable pilot structure:
Month 1: Configure the dashboard tiles above, assign one metric owner, and establish your baseline pass-through and time-to-offer numbers using Recruitify’s project-based hiring workflows.
Month 2: Run one funnel intervention (structured screening rubric or panel calibration) on a single role family, then measure the shift.
Month 3: Review results with hiring managers, expand what worked to two more role families, and set the quarterly leadership cadence.
[Internal case studies and specific outcome data will be added here as pilot results are documented.]
Measurement Is a Habit, Not a Report
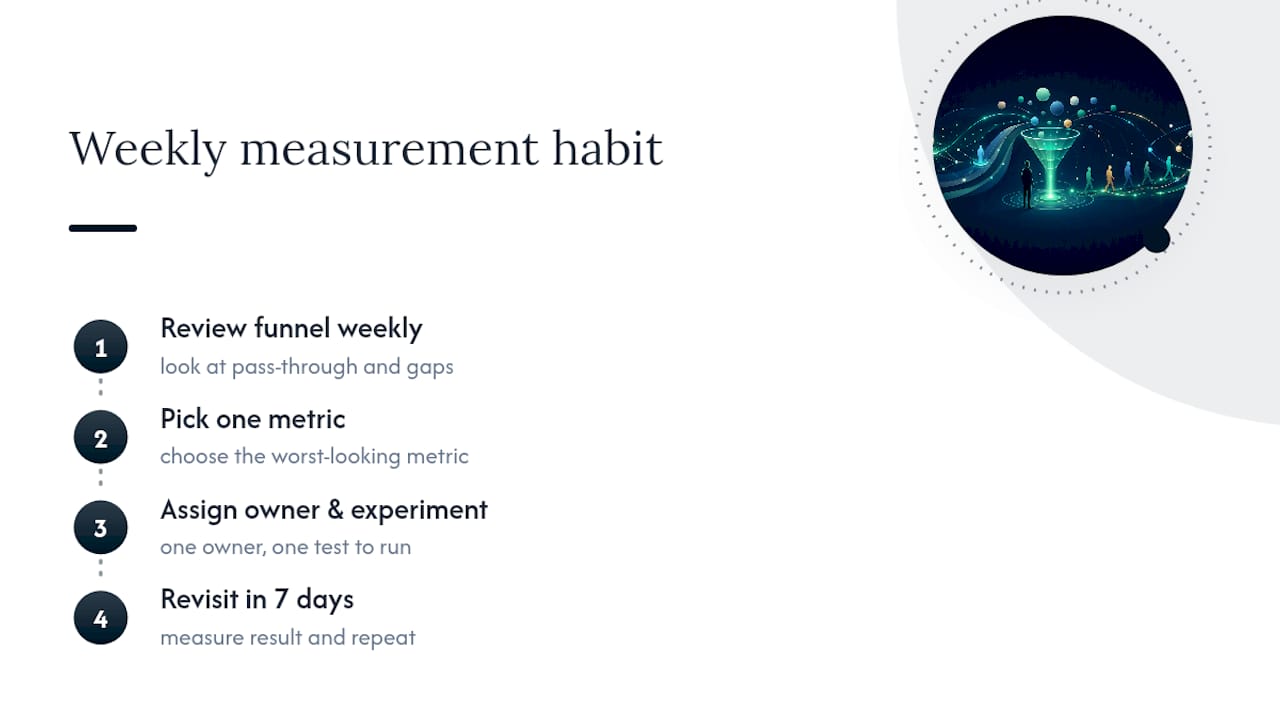
The teams that actually move their numbers are not the ones with the fanciest dashboard. They’re the ones who look at pass-through every single week and treat every gap as a hypothesis worth testing, not a verdict to defend. Fairness in hiring is built through dozens of small, measured corrections, not one annual audit.
Pick one funnel metric this week, the one that looks worst on your current data, and assign it to one owner with one experiment to try. Come back to it in seven days. That’s the whole program, repeated until it isn’t.
- Recruitify Team
See These Metrics Run Themselves in Recruitify
Recruitify turns the metric list above into something you check, not something you build by hand every Friday afternoon. Stage-move capture, pass-through calculations, time-to-offer tracking, and AI-driven screening scores update automatically as candidates move through your pipeline, so your recruiter view is current the moment a hiring manager makes a decision.
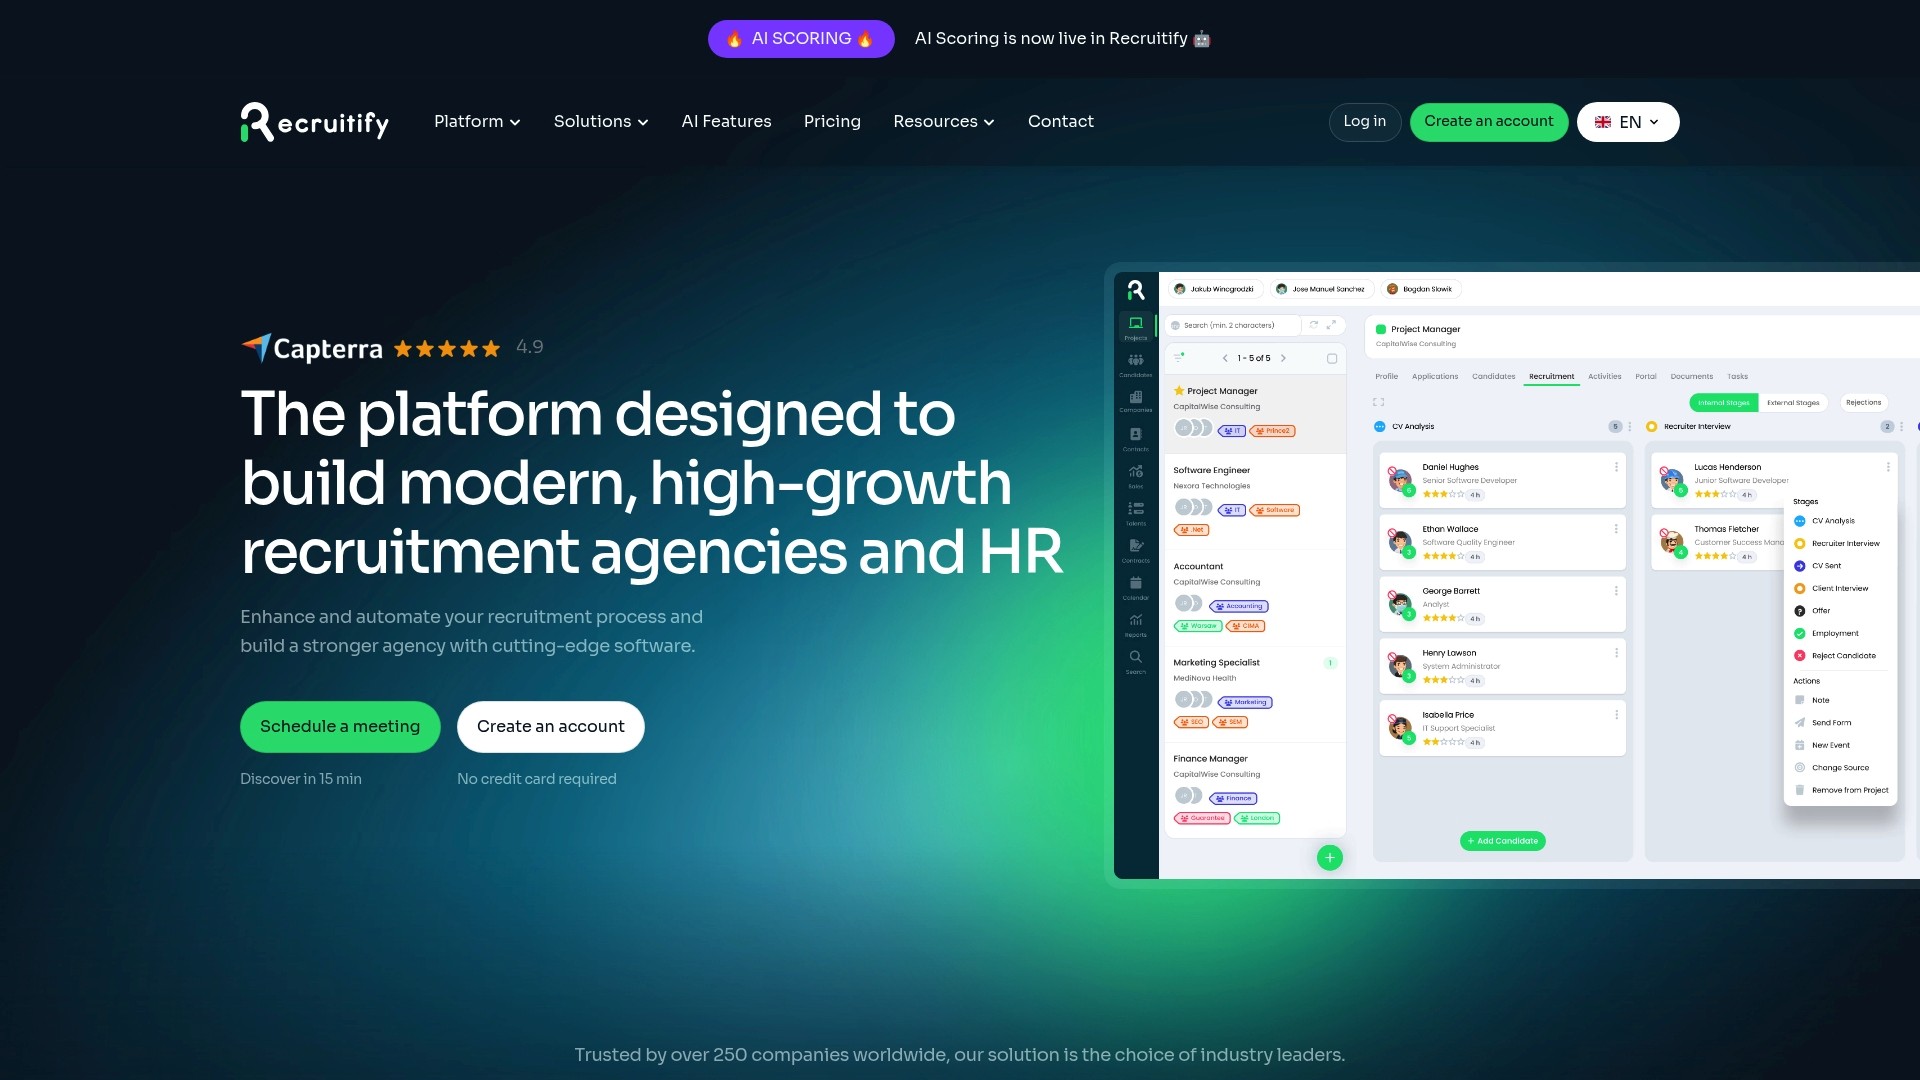
The platform’s AI candidate scoring applies the same rubric to every applicant, which is exactly the process-integrity fix most funnel gaps call for, and its multi-channel posting keeps source-mix data in one place instead of scattered across five job boards’ separate reports. If you’re ready to run the 3-month pilot outlined above without building a reporting pipeline from scratch, see how Recruitify’s ATS and CRM handle it, or start with a project-based rollout on your next open role.
Sources
Recommended


News & Updates
Stay up-to-date with the latest innovations, features, and tips about Recruitify!
By providing your email address within the newsletter sign-up form, you confirm its processing to send marketing information regarding the Administrator’s products and services. The Administrator of your personal data processed for the abovementioned purposes is Recruitify Spółka z o.o., based in Warsaw, Poland (KRS 0000709889). For more information on the principles of personal data processing and the rights of data subjects, please check the Privacy Policy.

Last updated:
Fix Funnel Bias Weekly: 10 Diversity Hiring Metrics for Recruiters
Innovations
The Recruitify Team
Fix Funnel Bias Weekly: 10 Diversity Hiring Metrics for Recruiters
Track seven metric groups, starting this week: funnel pass-through by cohort, time-to-hire and time-to-offer, offer acceptance, 30/90-day retention, candidate experience pulse, source mix, and structured-interview integrity. Review pass-through weekly with one designated owner, roll numbers up for hiring managers monthly, and summarize trends for leadership quarterly. Any segment under roughly 30 hires needs aggregation before you report it publicly.
TL;DR:
Tracking candidate outcomes like pass-through and offer acceptance rates by cohort reveals bias points and guides targeted process improvements.
Using at least 30 candidates per demographic segment before reporting ensures statistical reliability and protects individual privacy.
Regularly measuring time-to-offer and retention by group identifies delays and onboarding issues that impact diversity retention.
Standardizing screening with scored rubrics and calibrating interview panels help eliminate filtering bias across different candidate pools.
Automating data collection through platforms like Recruitify enables timely, accurate analysis and facilitates continuous, small adjustments to improve fairness.
Table of Contents
What Are Diversity Hiring Metrics, and Why Do They Matter?
The 10 Metrics Every Recruiting Team Should Track First
How to Measure Reliably: Sample Size, Segmentation, and Privacy
Diagnosing Bottlenecks: Turning a Metric Signal Into an Action
Building the Dashboard: Tiles, Views, and Reporting Cadence
Common Pitfalls That Undermine Diversity Hiring Data
Running a 3-Month Pilot With Recruitify
Measurement Is a Habit, Not a Report
See These Metrics Run Themselves in Recruitify
Sources
What Are Diversity Hiring Metrics, and Why Do They Matter?
Diversity hiring metrics are the data points that show whether your recruiting process treats candidates from different demographic groups fairly at every stage, from application through onboarding. That definition matters because most companies still measure the wrong thing: how many people from underrepresented groups they hired, rather than what happened to those candidates while they moved through the pipeline.
The business case is not abstract. Harvard Business Review’s analysis of failed diversity programs found that initiatives without structured measurement and linked process changes rarely produce lasting improvement. Programs that track outcomes and adjust the hiring process based on what the data shows tend to stick. Programs that run training sessions and hope for the best tend to fade within a year or two.
This is where the distinction between activity metrics and outcome metrics earns its keep. Activity metrics count effort: job fairs attended, LinkedIn posts published, resumes collected. Outcome metrics count results: who got screened, who got interviewed, who got an offer, and who accepted it. SHRM’s guidance on inclusion measurement leans hard on outcomes for a simple reason: activity can look busy while doing nothing to change who actually gets hired.
A useful gut check, before you build a dashboard:
Does this metric tell you what happened to a candidate, or just what your team did?
Can you segment it by demographic group without exposing individuals?
Would a hiring manager change their behavior if this number moved?
Recruitify’s own analytics layer is built around that third question, because a metric nobody acts on is just decoration.
The 10 Metrics Every Recruiting Team Should Track First
Instrumenting everything at once guarantees you’ll act on nothing. Start with these ten, in roughly this order of impact.
Applicant pool ratio. Numerator: applicants from a given demographic group; denominator: total applicants for the role. This tells you whether your top of funnel is broad enough before you even look at bias downstream. If the ratio badly trails your local labor market, the fix usually lives in sourcing channels and job description language, not in the screening step.
Screening pass-through rate. Numerator: candidates who clear resume/application screening from a cohort; denominator: applicants from that cohort. A gap here, especially one that dips below the four-fifths rule threshold used in U.S. adverse-impact analysis, points to screening criteria or rubric drift. Fix: standardize the screen with a scored rubric instead of a gut-check yes/no.
Interviewed diversity mix. Share of interview slots that go to candidates from each cohort, relative to their share of the screened pool. When this number drops between screening and interview, someone is quietly filtering people out before the panel ever sees them.
Interview-to-offer ratio. Numerator: offers extended from a cohort; denominator: candidates from that cohort who interviewed. This is where interviewer calibration issues show up. If one group consistently interviews well but doesn’t convert to offers, panel composition or unscored interview questions are the likely culprits.
Offer acceptance rate by cohort. Numerator: offers accepted; denominator: offers extended, split by group. Low acceptance in one cohort despite comparable offers elsewhere often signals a compensation gap, a slow process that lost the candidate to a competitor, or a weak candidate experience during final stages.
Time-to-first-interview and time-to-offer, segmented by group. If candidates from one cohort wait noticeably longer to hear back, that delay alone can explain lower acceptance rates. Measure the median, not the average, since a handful of stalled requisitions will otherwise skew the number.
30-day and 90-day retention by cohort. Retention gaps in the first quarter usually trace back to onboarding quality or a hiring process that oversold the role. This is the metric that tells you whether your funnel improvements are actually producing durable hires or just different-looking short-term ones.
Candidate experience pulse by demographic. A short post-interview or post-offer survey, broken out by group, catches friction that funnel numbers miss entirely, things like a panel that felt hostile or a process that felt confusing.
Source mix and pass-through by channel. Track which sourcing channels bring in diverse applicants and, separately, which channels’ candidates actually survive screening. A channel that brings volume but zero pass-through is wasting budget, not building pipeline.
Structured interview utilization and panel diversity. What share of interviews used a scored rubric versus an unscored conversation, and how diverse were the panels themselves. Sapia treats this as a leading indicator: teams that raise rubric usage tend to see pass-through gaps close within a quarter.
How to Measure Reliably: Sample Size, Segmentation, and Privacy
Your data sources are almost certainly already in place: your ATS for stage moves and dispositions, your interview scheduling or video platform for panel composition, your HRIS for post-hire retention, and a short pulse survey tool for experience data. The work is connecting them, not buying new ones.
Segment at the role-family and level, not just company-wide. An enterprise-wide pass-through number can hide a real problem in engineering hiring while sales looks fine, and vice versa. NextMantra’s practical measurement guide recommends measuring at the decision level, meaning the role, family, or hiring manager, because that’s the level where an actual intervention can be made.
Sample size is the part teams get wrong most often. A cohort of eight applicants does not support a meaningful pass-through percentage; a single hire or rejection swings the number by 12 points. For small hiring volumes, aggregate across 12 to 24 months or combine similar roles before drawing conclusions, and benchmark externally against EEOC EEO-1 employment data rather than publishing a tiny internal split that looks precise but isn’t.
Pro Tip: If a demographic segment has fewer than 30 candidates in a quarter, don’t report a percentage at all. Report the raw count and let the trend build over two or three quarters before you act on it.
Privacy is not optional overhead here, it’s what makes the data trustworthy enough to use. Self-identification data should be collected through opt-in surveys with a clear opt-out, stored separately from resume and interview data, and reported only in aggregate with automatic suppression below your minimum threshold. Cross-border teams need extra caution: several countries restrict collecting race or ethnicity data entirely, so a global dashboard needs country-aware rules, not a single template.
Diagnosing Bottlenecks: Turning a Metric Signal Into an Action
Every recurring pattern in your funnel data points to a specific, fixable cause. The trick is resisting the urge to fix everything at once.
Low screening pass-through for one cohort usually means unscored screening criteria or a rubric that quietly favors a specific background. Fix: introduce blind or structured screening with a scored checklist.
Strong interviews but weak offer conversion points to panel calibration issues or informal decision-making after the interview. Fix: standardize interview scoring and require written justification for any hire/no-hire call.
Healthy applicant pool but thin diversity in interviews suggests filtering happens earlier than anyone admits. Fix: audit who screens resumes and whether they’re using the same rubric as everyone else.
Low offer acceptance in one cohort despite comparable offers often traces to a slow process or a compensation gap. Fix: benchmark time-to-offer and pay bands by cohort before assuming it’s a candidate preference issue.
Broad top-of-funnel diversity but narrow source pass-through means a channel is bringing volume without quality. Fix: reallocate sourcing spend toward channels with proven pass-through, not just raw applicant count.
Pro Tip: Run one change, with one accountable owner, for one week, then measure the effect before layering on a second change. Stacking three fixes at once makes it impossible to know which one actually moved the number.
Building the Dashboard: Tiles, Views, and Reporting Cadence
A dashboard that tries to serve everyone ends up serving no one. Build three distinct views instead of one crowded screen.
Recruiter view (weekly): funnel pass-through by stage and cohort, time-to-first-interview, and source mix. This is the working board, checked every week by the metric owner.
Hiring manager view (monthly): interview-to-offer ratio, offer acceptance, and structured-interview utilization for their open roles. Recruitment analytics guidance points out that automating this collection through your ATS removes the manual reporting lag that kills monthly reviews.
Leadership view (quarterly): trend lines on retention, aggregate pass-through, and source effectiveness, always shown with the sample size behind each number.
Set escalation thresholds in advance: a pass-through gap that persists for two consecutive reporting periods, not just one bad month, should trigger a review. And every leadership tile showing a percentage needs the underlying count next to it, so a 20-point swing on nine candidates doesn’t get treated the same as a 20-point swing on 400.
View | Cadence | Primary tiles |
|---|---|---|
Recruiter | Weekly | Pass-through by stage, time-to-interview, source mix |
Hiring manager | Monthly | Interview-to-offer, offer acceptance, rubric usage |
Leadership | Quarterly | Retention trends, aggregate pass-through, sample sizes |
Common Pitfalls That Undermine Diversity Hiring Data
Measurement programs fail in predictable ways, and most of the damage is self-inflicted.
Tracking headcount alone tells you nothing about fairness in the process that produced it.
Over-indexing on activity metrics (job fairs, impressions, applications) creates the appearance of progress without changing outcomes.
Publicizing tiny counts as precise percentages erodes trust the moment someone does the math and realizes it’s four people.
Treating metrics as quotas rather than diagnostic tools invites the exact legal and cultural backlash measurement was supposed to prevent.
This quarter, stop reporting any percentage built on fewer than 30 candidates, and start sharing pass-through trends with employee resource groups before you share them with leadership. Transparency with the people the data is about builds more trust than a polished slide deck ever will.
Running a 3-Month Pilot With Recruitify
Manually pulling stage-move data out of spreadsheets is the single biggest reason diversity metric programs stall before month two. Recruitify’s platform captures every stage transition, disposition, and interview score automatically, so pass-through calculations update themselves instead of waiting for someone to compile a report.
A workable pilot structure:
Month 1: Configure the dashboard tiles above, assign one metric owner, and establish your baseline pass-through and time-to-offer numbers using Recruitify’s project-based hiring workflows.
Month 2: Run one funnel intervention (structured screening rubric or panel calibration) on a single role family, then measure the shift.
Month 3: Review results with hiring managers, expand what worked to two more role families, and set the quarterly leadership cadence.
[Internal case studies and specific outcome data will be added here as pilot results are documented.]
Measurement Is a Habit, Not a Report
The teams that actually move their numbers are not the ones with the fanciest dashboard. They’re the ones who look at pass-through every single week and treat every gap as a hypothesis worth testing, not a verdict to defend. Fairness in hiring is built through dozens of small, measured corrections, not one annual audit.
Pick one funnel metric this week, the one that looks worst on your current data, and assign it to one owner with one experiment to try. Come back to it in seven days. That’s the whole program, repeated until it isn’t.
- Recruitify Team
See These Metrics Run Themselves in Recruitify
Recruitify turns the metric list above into something you check, not something you build by hand every Friday afternoon. Stage-move capture, pass-through calculations, time-to-offer tracking, and AI-driven screening scores update automatically as candidates move through your pipeline, so your recruiter view is current the moment a hiring manager makes a decision.
The platform’s AI candidate scoring applies the same rubric to every applicant, which is exactly the process-integrity fix most funnel gaps call for, and its multi-channel posting keeps source-mix data in one place instead of scattered across five job boards’ separate reports. If you’re ready to run the 3-month pilot outlined above without building a reporting pipeline from scratch, see how Recruitify’s ATS and CRM handle it, or start with a project-based rollout on your next open role.
Sources
Recommended
News & Updates
Stay up-to-date with the latest innovations, features, and tips about Recruitify!
By providing your email address within the newsletter sign-up form, you confirm its processing to send marketing information regarding the Administrator’s products and services. The Administrator of your personal data processed for the abovementioned purposes is Recruitify Spółka z o.o., based in Warsaw, Poland (KRS 0000709889). For more information on the principles of personal data processing and the rights of data subjects, please check the Privacy Policy.
Last updated:
Fix Funnel Bias Weekly: 10 Diversity Hiring Metrics for Recruiters
Innovations
The Recruitify Team
Fix Funnel Bias Weekly: 10 Diversity Hiring Metrics for Recruiters
Track seven metric groups, starting this week: funnel pass-through by cohort, time-to-hire and time-to-offer, offer acceptance, 30/90-day retention, candidate experience pulse, source mix, and structured-interview integrity. Review pass-through weekly with one designated owner, roll numbers up for hiring managers monthly, and summarize trends for leadership quarterly. Any segment under roughly 30 hires needs aggregation before you report it publicly.
TL;DR:
Tracking candidate outcomes like pass-through and offer acceptance rates by cohort reveals bias points and guides targeted process improvements.
Using at least 30 candidates per demographic segment before reporting ensures statistical reliability and protects individual privacy.
Regularly measuring time-to-offer and retention by group identifies delays and onboarding issues that impact diversity retention.
Standardizing screening with scored rubrics and calibrating interview panels help eliminate filtering bias across different candidate pools.
Automating data collection through platforms like Recruitify enables timely, accurate analysis and facilitates continuous, small adjustments to improve fairness.
Table of Contents
What Are Diversity Hiring Metrics, and Why Do They Matter?
The 10 Metrics Every Recruiting Team Should Track First
How to Measure Reliably: Sample Size, Segmentation, and Privacy
Diagnosing Bottlenecks: Turning a Metric Signal Into an Action
Building the Dashboard: Tiles, Views, and Reporting Cadence
Common Pitfalls That Undermine Diversity Hiring Data
Running a 3-Month Pilot With Recruitify
Measurement Is a Habit, Not a Report
See These Metrics Run Themselves in Recruitify
Sources
What Are Diversity Hiring Metrics, and Why Do They Matter?
Diversity hiring metrics are the data points that show whether your recruiting process treats candidates from different demographic groups fairly at every stage, from application through onboarding. That definition matters because most companies still measure the wrong thing: how many people from underrepresented groups they hired, rather than what happened to those candidates while they moved through the pipeline.
The business case is not abstract. Harvard Business Review’s analysis of failed diversity programs found that initiatives without structured measurement and linked process changes rarely produce lasting improvement. Programs that track outcomes and adjust the hiring process based on what the data shows tend to stick. Programs that run training sessions and hope for the best tend to fade within a year or two.
This is where the distinction between activity metrics and outcome metrics earns its keep. Activity metrics count effort: job fairs attended, LinkedIn posts published, resumes collected. Outcome metrics count results: who got screened, who got interviewed, who got an offer, and who accepted it. SHRM’s guidance on inclusion measurement leans hard on outcomes for a simple reason: activity can look busy while doing nothing to change who actually gets hired.
A useful gut check, before you build a dashboard:
Does this metric tell you what happened to a candidate, or just what your team did?
Can you segment it by demographic group without exposing individuals?
Would a hiring manager change their behavior if this number moved?
Recruitify’s own analytics layer is built around that third question, because a metric nobody acts on is just decoration.
The 10 Metrics Every Recruiting Team Should Track First
Instrumenting everything at once guarantees you’ll act on nothing. Start with these ten, in roughly this order of impact.
Applicant pool ratio. Numerator: applicants from a given demographic group; denominator: total applicants for the role. This tells you whether your top of funnel is broad enough before you even look at bias downstream. If the ratio badly trails your local labor market, the fix usually lives in sourcing channels and job description language, not in the screening step.
Screening pass-through rate. Numerator: candidates who clear resume/application screening from a cohort; denominator: applicants from that cohort. A gap here, especially one that dips below the four-fifths rule threshold used in U.S. adverse-impact analysis, points to screening criteria or rubric drift. Fix: standardize the screen with a scored rubric instead of a gut-check yes/no.
Interviewed diversity mix. Share of interview slots that go to candidates from each cohort, relative to their share of the screened pool. When this number drops between screening and interview, someone is quietly filtering people out before the panel ever sees them.
Interview-to-offer ratio. Numerator: offers extended from a cohort; denominator: candidates from that cohort who interviewed. This is where interviewer calibration issues show up. If one group consistently interviews well but doesn’t convert to offers, panel composition or unscored interview questions are the likely culprits.
Offer acceptance rate by cohort. Numerator: offers accepted; denominator: offers extended, split by group. Low acceptance in one cohort despite comparable offers elsewhere often signals a compensation gap, a slow process that lost the candidate to a competitor, or a weak candidate experience during final stages.
Time-to-first-interview and time-to-offer, segmented by group. If candidates from one cohort wait noticeably longer to hear back, that delay alone can explain lower acceptance rates. Measure the median, not the average, since a handful of stalled requisitions will otherwise skew the number.
30-day and 90-day retention by cohort. Retention gaps in the first quarter usually trace back to onboarding quality or a hiring process that oversold the role. This is the metric that tells you whether your funnel improvements are actually producing durable hires or just different-looking short-term ones.
Candidate experience pulse by demographic. A short post-interview or post-offer survey, broken out by group, catches friction that funnel numbers miss entirely, things like a panel that felt hostile or a process that felt confusing.
Source mix and pass-through by channel. Track which sourcing channels bring in diverse applicants and, separately, which channels’ candidates actually survive screening. A channel that brings volume but zero pass-through is wasting budget, not building pipeline.
Structured interview utilization and panel diversity. What share of interviews used a scored rubric versus an unscored conversation, and how diverse were the panels themselves. Sapia treats this as a leading indicator: teams that raise rubric usage tend to see pass-through gaps close within a quarter.
How to Measure Reliably: Sample Size, Segmentation, and Privacy
Your data sources are almost certainly already in place: your ATS for stage moves and dispositions, your interview scheduling or video platform for panel composition, your HRIS for post-hire retention, and a short pulse survey tool for experience data. The work is connecting them, not buying new ones.
Segment at the role-family and level, not just company-wide. An enterprise-wide pass-through number can hide a real problem in engineering hiring while sales looks fine, and vice versa. NextMantra’s practical measurement guide recommends measuring at the decision level, meaning the role, family, or hiring manager, because that’s the level where an actual intervention can be made.
Sample size is the part teams get wrong most often. A cohort of eight applicants does not support a meaningful pass-through percentage; a single hire or rejection swings the number by 12 points. For small hiring volumes, aggregate across 12 to 24 months or combine similar roles before drawing conclusions, and benchmark externally against EEOC EEO-1 employment data rather than publishing a tiny internal split that looks precise but isn’t.
Pro Tip: If a demographic segment has fewer than 30 candidates in a quarter, don’t report a percentage at all. Report the raw count and let the trend build over two or three quarters before you act on it.
Privacy is not optional overhead here, it’s what makes the data trustworthy enough to use. Self-identification data should be collected through opt-in surveys with a clear opt-out, stored separately from resume and interview data, and reported only in aggregate with automatic suppression below your minimum threshold. Cross-border teams need extra caution: several countries restrict collecting race or ethnicity data entirely, so a global dashboard needs country-aware rules, not a single template.
Diagnosing Bottlenecks: Turning a Metric Signal Into an Action
Every recurring pattern in your funnel data points to a specific, fixable cause. The trick is resisting the urge to fix everything at once.
Low screening pass-through for one cohort usually means unscored screening criteria or a rubric that quietly favors a specific background. Fix: introduce blind or structured screening with a scored checklist.
Strong interviews but weak offer conversion points to panel calibration issues or informal decision-making after the interview. Fix: standardize interview scoring and require written justification for any hire/no-hire call.
Healthy applicant pool but thin diversity in interviews suggests filtering happens earlier than anyone admits. Fix: audit who screens resumes and whether they’re using the same rubric as everyone else.
Low offer acceptance in one cohort despite comparable offers often traces to a slow process or a compensation gap. Fix: benchmark time-to-offer and pay bands by cohort before assuming it’s a candidate preference issue.
Broad top-of-funnel diversity but narrow source pass-through means a channel is bringing volume without quality. Fix: reallocate sourcing spend toward channels with proven pass-through, not just raw applicant count.
Pro Tip: Run one change, with one accountable owner, for one week, then measure the effect before layering on a second change. Stacking three fixes at once makes it impossible to know which one actually moved the number.
Building the Dashboard: Tiles, Views, and Reporting Cadence
A dashboard that tries to serve everyone ends up serving no one. Build three distinct views instead of one crowded screen.
Recruiter view (weekly): funnel pass-through by stage and cohort, time-to-first-interview, and source mix. This is the working board, checked every week by the metric owner.
Hiring manager view (monthly): interview-to-offer ratio, offer acceptance, and structured-interview utilization for their open roles. Recruitment analytics guidance points out that automating this collection through your ATS removes the manual reporting lag that kills monthly reviews.
Leadership view (quarterly): trend lines on retention, aggregate pass-through, and source effectiveness, always shown with the sample size behind each number.
Set escalation thresholds in advance: a pass-through gap that persists for two consecutive reporting periods, not just one bad month, should trigger a review. And every leadership tile showing a percentage needs the underlying count next to it, so a 20-point swing on nine candidates doesn’t get treated the same as a 20-point swing on 400.
View | Cadence | Primary tiles |
|---|---|---|
Recruiter | Weekly | Pass-through by stage, time-to-interview, source mix |
Hiring manager | Monthly | Interview-to-offer, offer acceptance, rubric usage |
Leadership | Quarterly | Retention trends, aggregate pass-through, sample sizes |
Common Pitfalls That Undermine Diversity Hiring Data
Measurement programs fail in predictable ways, and most of the damage is self-inflicted.
Tracking headcount alone tells you nothing about fairness in the process that produced it.
Over-indexing on activity metrics (job fairs, impressions, applications) creates the appearance of progress without changing outcomes.
Publicizing tiny counts as precise percentages erodes trust the moment someone does the math and realizes it’s four people.
Treating metrics as quotas rather than diagnostic tools invites the exact legal and cultural backlash measurement was supposed to prevent.
This quarter, stop reporting any percentage built on fewer than 30 candidates, and start sharing pass-through trends with employee resource groups before you share them with leadership. Transparency with the people the data is about builds more trust than a polished slide deck ever will.
Running a 3-Month Pilot With Recruitify
Manually pulling stage-move data out of spreadsheets is the single biggest reason diversity metric programs stall before month two. Recruitify’s platform captures every stage transition, disposition, and interview score automatically, so pass-through calculations update themselves instead of waiting for someone to compile a report.
A workable pilot structure:
Month 1: Configure the dashboard tiles above, assign one metric owner, and establish your baseline pass-through and time-to-offer numbers using Recruitify’s project-based hiring workflows.
Month 2: Run one funnel intervention (structured screening rubric or panel calibration) on a single role family, then measure the shift.
Month 3: Review results with hiring managers, expand what worked to two more role families, and set the quarterly leadership cadence.
[Internal case studies and specific outcome data will be added here as pilot results are documented.]
Measurement Is a Habit, Not a Report
The teams that actually move their numbers are not the ones with the fanciest dashboard. They’re the ones who look at pass-through every single week and treat every gap as a hypothesis worth testing, not a verdict to defend. Fairness in hiring is built through dozens of small, measured corrections, not one annual audit.
Pick one funnel metric this week, the one that looks worst on your current data, and assign it to one owner with one experiment to try. Come back to it in seven days. That’s the whole program, repeated until it isn’t.
- Recruitify Team
See These Metrics Run Themselves in Recruitify
Recruitify turns the metric list above into something you check, not something you build by hand every Friday afternoon. Stage-move capture, pass-through calculations, time-to-offer tracking, and AI-driven screening scores update automatically as candidates move through your pipeline, so your recruiter view is current the moment a hiring manager makes a decision.
The platform’s AI candidate scoring applies the same rubric to every applicant, which is exactly the process-integrity fix most funnel gaps call for, and its multi-channel posting keeps source-mix data in one place instead of scattered across five job boards’ separate reports. If you’re ready to run the 3-month pilot outlined above without building a reporting pipeline from scratch, see how Recruitify’s ATS and CRM handle it, or start with a project-based rollout on your next open role.
Sources
Recommended
News & Updates
Stay up-to-date with the latest innovations, features, and tips about Recruitify!
By providing your email address within the newsletter sign-up form, you confirm its processing to send marketing information regarding the Administrator’s products and services. The Administrator of your personal data processed for the abovementioned purposes is Recruitify Spółka z o.o., based in Warsaw, Poland (KRS 0000709889). For more information on the principles of personal data processing and the rights of data subjects, please check the Privacy Policy.

Discover More

Recruitment Process
Keep Recruiters in Charge: Sourcing Automation With Human Approval Gates
Learn how recruiters can adopt sourcing automation safely: compare AI-assisted and agentic models, set human approval gates, and run a scoped pilot.
1 Sept 2026
Discover More

Recruitment Process
30 Day SMS Recruiting Pilot for HR Teams and Hiring Managers
Run a compliant 30 day SMS recruiting pilot with six templates, TCPA and carrier guardrails, and an ATS integration checklist to measure results.
31 Aug 2026
Discover More

Recruitment Process
12 trends that HR leaders must prioritise right now for 2026
A practical prioritisation framework for HR leaders: twelve game-changing HR tech trends, a strategic 0-3, 3-9, and 12+ month roadmap, actionable checklists, and...
30 Aug 2026
Discover More
Recruitment Process
Keep Recruiters in Charge: Sourcing Automation With Human Approval Gates
Learn how recruiters can adopt sourcing automation safely: compare AI-assisted and agentic models, set human approval gates, and run a scoped pilot.
1 Sept 2026
Discover More
Recruitment Process
30 Day SMS Recruiting Pilot for HR Teams and Hiring Managers
Run a compliant 30 day SMS recruiting pilot with six templates, TCPA and carrier guardrails, and an ATS integration checklist to measure results.
31 Aug 2026
Discover More