
Last updated:
Offer Acceptance Rate for HR Teams: Why Faster Offers Still Fail

Recruitment Process

The Recruitify Team
Offer acceptance rate measures the share of job offers candidates accept, calculated as (offers accepted divided by offers sent) multiplied by 100. There is no single universal benchmark because the figure shifts by role, seniority, and market conditions, but it remains one of the clearest signals of whether your compensation, speed, and candidate experience are working together or against each other.
RecruitifyKeep Offers Moving With RecruitifyRecruitify brings sales and recruitment pipelines together, with workflow automation to help IT recruitment teams manage offers and placements.Explore Recruitify
Key Takeaways
Improving offer acceptance rates requires faster offers, better candidate engagement, and precise data tracking, as acceptance is a key indicator of recruitment success.
Point | Details |
|---|---|
Speed of offer process | Compress the timeline from final interview to offer to increase candidate acceptance and improve recruitment flow. |
Present full rewards | Clearly communicate total compensation, including base, bonus, benefits, and growth prospects, during the offer stage. |
Capture candidate signals | Use pre-offer check-ins to identify candidate concerns early and address objections before they lead to declines. |
Personalized communication | Use high-touch outreach, such as phone calls from hiring managers, especially for senior roles, to boost acceptance. |
Automate and track recruiting data | Leverage automation tools for follow-ups and use detailed segmentation to identify weak spots and inform tactics. |
Table of Contents
What offer acceptance rate measures and why it matters
How to calculate offer acceptance rate, including edge cases
What data fields you need and how to segment the metric
Benchmarks and how to interpret your acceptance rate
Common reasons candidates decline offers
Prioritized tactics to increase offer acceptance rate
How to measure, report, and track progress
Applied example: what automation changes at offer stage
Common calculation mistakes and how to avoid them
Related metrics to track alongside offer acceptance rate
What we’ve learned about raising acceptance rates
How Recruitify helps you close more offers, faster
FAQ
Sources
What offer acceptance rate measures and why it matters
Offer acceptance rate is a lagging indicator of almost everything that happened earlier in your hiring process. A low number rarely means candidates suddenly disliked your offer letter. It usually means compensation lagged the market, the process dragged long enough for a competitor to move faster, or the candidate experience left doubts that surfaced right before signing.
The business cost compounds quickly when acceptance rates slip. Every declined offer means restarting part of the pipeline, which lengthens time-to-fill, consumes recruiter capacity, and often forces hiring managers to settle for a weaker runner-up candidate or leave a seat empty while revenue-generating work waits.
That said, acceptance rate deserves priority attention mainly when your upstream metrics are healthy. If your interview-to-offer ratio is already weak, fixing that funnel stage usually produces a bigger return than optimizing the final step. Acceptance rate becomes the right lever to pull when:
Your pipeline consistently produces qualified finalists but offers stall at the finish line.
Time-to-offer has crept upward relative to your market’s hiring pace.
Recruiters report candidates citing competing offers or compensation gaps during final-stage conversations.
How to calculate offer acceptance rate, including edge cases
The canonical formula is straightforward: Offer Acceptance Rate = (Offers Accepted ÷ Offers Sent) × 100. The complexity lives in deciding what counts as “sent” and what counts as “accepted.”
Count an offer as “sent” only once it reaches the candidate formally, not when a hiring manager verbally floats a number.
Count an offer as “accepted” only when the candidate confirms in writing, not when they verbally agree pending negotiation.
Exclude withdrawn offers (pulled by the employer before a candidate responds) from the denominator entirely, since the candidate never had a chance to decide.
Treat conditional offers, those pending background checks or references, as pending until the condition resolves; do not count them as accepted until confirmed.
Flag reneges (candidates who accept, then back out before start date) separately from declines, since they distort both acceptance rate and workforce planning if blended together.
A worked example: your team sends 40 offers in a quarter. Thirty-two candidates accept in writing, five decline outright, and three are withdrawn by your hiring managers before a response. Drop a formula into a spreadsheet column next to your offer log and it updates automatically as new rows come in.
What data fields you need and how to segment the metric
Accurate acceptance rate tracking depends on capturing the right fields at the moment an offer is extended, not reconstructing them later from memory or email threads.
Offer sent date: the timestamp an offer formally reaches the candidate, which anchors your time-to-offer calculations too.
Status: accepted, declined, withdrawn, conditional-pending, or renege, kept as distinct values rather than a single “closed” flag.
Role and role family: engineering, sales, operations, and so on, since acceptance behavior varies sharply across functions.
Seniority level: individual contributor, manager, director, executive, because negotiation dynamics differ by level.
Source: inbound application, recruiter sourced, referral, or agency, to see which channels produce offers that stick.
Offered compensation: base, bonus, and equity where applicable, so you can later correlate pay positioning with decline patterns.
Segment your dashboard by role family, level, hiring team, source, geography, and time period so a strong aggregate number cannot hide a weak segment.
Pro Tip: Automate status updates directly from your applicant tracking system instead of relying on recruiters to log outcomes manually, since manual logs are the most common source of missing or stale offer-status data.
Benchmarks and how to interpret your acceptance rate
Published benchmarks vary widely because sample sets differ by industry, geography, and seniority mix, so treat any single figure as a reference point rather than a target to hit exactly. Statista’s technology talent series tracks offer-acceptance success rates specifically for technology roles, which is a useful comparison if your hiring mix skews toward engineering and IT talent, but it will understate or overstate your real position if your roles sit outside that category.
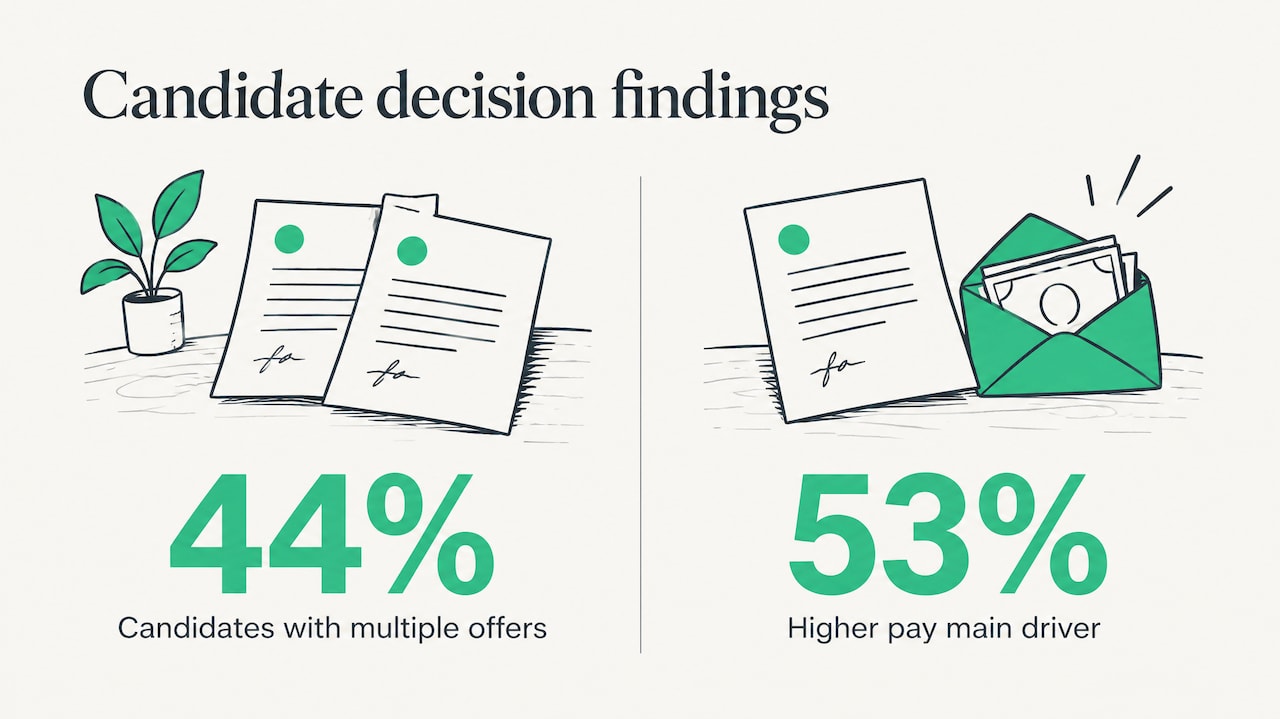
Candidates now routinely weigh multiple offers at once. Gartner’s first-quarter 2025 research found that 44% of prospective candidates received multiple job offers in that quarter, and 53% of candidates cited higher compensation as their main decision driver when choosing among them. A candidate weighing two or three live offers is a candidate who will decline yours the moment your compensation or timeline falls short.
Adjust your expectations by level. Entry-level and mid-level individual contributor roles typically see higher acceptance because fewer competing offers exist at that volume. Senior, specialized, and executive roles see more volatility because the candidate pool is smaller and each person is more likely to be courted elsewhere simultaneously.
Build internal benchmark bands instead of chasing an external number: track your own acceptance rate by role family over the last four quarters, set a realistic improvement target of a few percentage points per segment, and treat any segment below your internal median as a priority for the tactics below.
Common reasons candidates decline offers
A structured decline audit beats guesswork. Before changing anything, review your last 15 to 20 declined offers and tag each by primary reason.
Compensation gap: the offered package fell short of market rate or the candidate’s current comp.
Competing offer: the candidate accepted or was close to accepting elsewhere, often one that moved faster.
Unclear role expectations: the candidate felt uncertain about scope, reporting lines, or growth path even after interviews.
Timing mismatch: start date, notice period, or offer-to-decision window didn’t fit the candidate’s situation.
Poor process experience: slow communication, disorganized interviews, or inconsistent messaging eroded trust before the offer even arrived.
Interview-stage signals often predict a decline before it happens: a candidate who goes quiet between rounds, asks pointed questions about other active processes, or hesitates on availability for a final interview is telling you something. Run a seven-day audit on a rolling basis: pull every decline from the past week, have the assigned recruiter log the primary reason in a shared field, and review patterns at your weekly team meeting rather than letting individual declines disappear into anecdote.
Prioritized tactics to increase offer acceptance rate
Not every lever deserves equal attention. Work through these in order, since speed and signal capture tend to produce the fastest measurable gains.
Compress your offer timeline first. Candidate experience benchmark research from ERE found that 64% of candidates waited less than a week between their final interview and receiving an offer, and companies that hit that window saw stronger referral and relationship outcomes. Set an internal target of five business days from final interview to offer, and automate the handoff between interview feedback collection and offer drafting so it doesn’t wait on a single manager’s calendar.
Frame total rewards, not just base salary. Given that compensation was the top decision driver for 53% of candidates in Gartner’s 1Q25 research, present the full package, bonus structure, equity, benefits, and growth trajectory, in the offer conversation itself rather than burying it in a PDF the candidate reads alone.
Capture interview signals before you write the offer. A short structured pre-offer check-in, where the recruiter directly asks about competing processes, timeline pressure, and remaining concerns, lets you address objections before they turn into a decline. This is cheaper than renegotiating after the fact.
Personalize the outreach at offer stage. A phone call from the hiring manager carries more weight than an automated email, especially for senior roles. Reserve the high-touch version for your highest-priority hires and automate the rest.
Build a negotiation playbook for common counteroffers. Pre-approve ranges for base, sign-on bonus, and start-date flexibility so recruiters can respond within hours instead of escalating through three layers of approval while the candidate’s other offer deadline passes.
Fix the operational layer underneath everything else. Maintain warm talent pools so you’re not starting from zero when a role reopens, automate offer-stage follow-ups so no candidate waits in silence, and assign clear process ownership so no offer sits unanswered because two people assumed the other was handling it.
Pro Tip: Give every open requisition a single named owner for the offer stage specifically, separate from the sourcing owner, so accountability for speed never falls between two people.
How to measure, report, and track progress
Treat acceptance rate as a dashboard metric with multiple slices, not a single quarterly number buried in a slide deck.
Acceptance rate by role family and level, updated at least monthly, to catch segment-level weakness early.
Acceptance rate by source, so you can see whether referrals, agency submissions, or inbound applicants convert differently at offer stage.
Acceptance rate by recruiter and hiring team, used developmentally rather than punitively, to spot where coaching or process support would help.
Time-to-offer trend, tracked alongside acceptance rate since the two usually move together.
While running any intervention, watch leading indicators before the acceptance number itself moves: time spent in each interview stage, candidate satisfaction scores collected right after the offer conversation, and the frequency of positive signal flags from your pre-offer check-ins.
Dashboard slice | What it reveals | Suggested review cadence |
|---|---|---|
Acceptance rate by role family | Which functions are losing candidates at offer stage | Monthly |
Acceptance rate by source | Which sourcing channels produce offers that stick | Monthly |
Time-to-offer by team | Where delays are concentrated | Weekly |
Decline reason tags | Root causes behind lost offers | Weekly |
Run interventions as small, time-boxed experiments, change one variable, such as offer timeline or compensation framing, for one segment over a single quarter, then compare against your historical baseline before rolling it out company-wide.
Applied example: what automation changes at offer stage
A recurring pattern among agencies that consolidate their recruitment workflow into a single system is a meaningful jump in candidate throughput without adding headcount. Recruitify’s own case study on moving from spreadsheets to automation describes a recruitment agency that increased the number of presented candidates after replacing scattered spreadsheets with automated workflows and an organized talent pool.
Consolidating candidate data into searchable talent pools, automating offer-stage follow-ups, and maintaining a GDPR consent audit trail let the team present more candidates without expanding the recruiter headcount.
The workflows that mattered most were talent pool reactivation, which let the agency resurface previously sourced candidates instead of starting sourcing from zero, and automated follow-up sequencing, which kept candidates informed between interview and offer instead of leaving them in silence. A practical first pilot: audit your own dormant candidate database for one role family and measure how many previously screened candidates could re-enter an active pipeline this month.
Common calculation mistakes and how to avoid them
Small counting errors produce big misreads. Avoid these before trusting your dashboard.
Counting withdrawn offers as declines: this understates your true acceptance rate, since the candidate never got to choose.
Counting conditional offers as accepted before conditions clear: this inflates your number temporarily, then creates confusing reversals later.
Mixing internal transfers with external hires: internal moves almost always accept, which artificially inflates your blended rate.
Drawing conclusions from small samples: a single department with five offers in a quarter can swing from 60% to 100% on one decision, so treat low-volume segments with wider margins before reacting.
Ignoring seasonal patterns: acceptance rates often dip around major holiday periods or fiscal year-end, so compare year-over-year periods, not just adjacent quarters.
Before presenting any number, run a quick checklist: confirm withdrawn offers are excluded from the denominator, confirm conditional offers are marked pending, and confirm your sample size supports the conclusion you’re drawing.
Related metrics to track alongside offer acceptance rate
Offer acceptance rate tells a fuller story when paired with metrics that explain the “why” behind the number.
Time-to-offer and time-to-hire: these reveal whether speed, or the lack of it, is driving declines.
Offer decline reasons, captured qualitatively from every decline rather than inferred, to catch patterns before they become trends.
Candidate experience and hiring manager satisfaction scores, which surface friction points earlier in the funnel that eventually show up as offer-stage losses.
What we’ve learned about raising acceptance rates
Our view, after working closely with recruitment teams on this problem, is that speed beats almost every other lever. A fast, well-communicated offer consistently outperforms a slightly better-paying one that arrives a week late. Second, data hygiene matters more than most teams admit: you cannot fix what you aren’t accurately measuring at the status level. Third, automation isn’t a shortcut around good recruiting judgment, it’s what frees recruiters to use that judgment at the moments that actually decide whether a candidate signs.
- Recruitify Team
How Recruitify helps you close more offers, faster
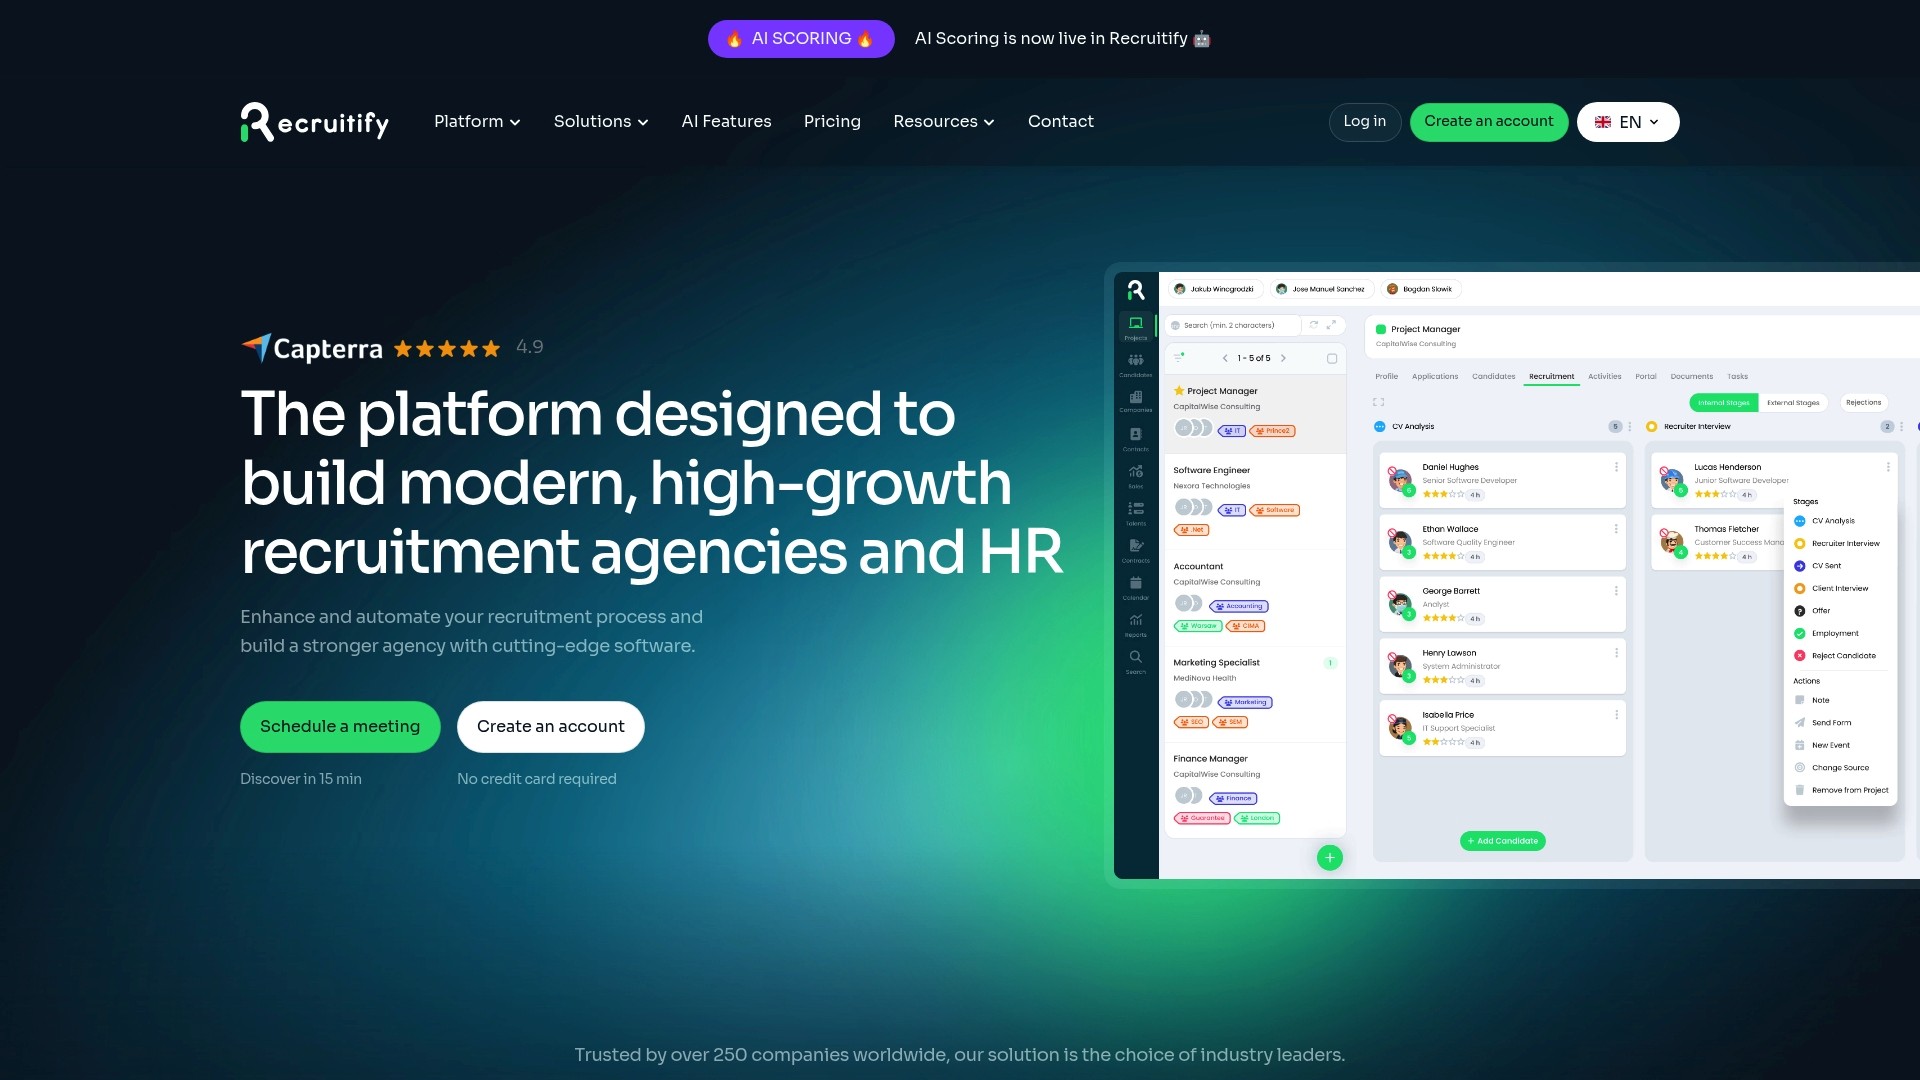
We built our platform to remove the operational drag that slows offers down. Our contextual matching AI surfaces ready shortlists from your existing talent pools, so you’re not restarting sourcing every time a role opens. Our automation engine handles offer-stage follow-ups and status tracking, keeping candidates informed and your dashboard accurate without manual logging. Our GDPR consent audit trail keeps your data clean and defensible as you scale.
Talent pool reactivation to shorten time-to-offer.
Automated follow-up sequencing so no candidate waits in silence.
Full audit trail for every candidate record, built for compliance and reporting.
If you’re ready to see these workflows in your own pipeline, check our pricing plans, including the HR Team and Recruitment Agencies tiers, and request a walkthrough.
FAQ
Is acceptance rate the same as offer rate?
No. Offer acceptance rate measures the share of extended offers that candidates accept, while offer rate typically refers to the share of interviewed or final-stage candidates who receive an offer in the first place. They measure different stages of the same funnel.
What does “offer rate” mean?
Offer rate describes how often your hiring process results in an extended offer, usually calculated as offers made divided by candidates who reached the final interview stage. It’s an upstream metric that precedes acceptance rate rather than a substitute for it.
What is the offer acceptance ratio?
The offer acceptance ratio is another name for offer acceptance rate: the number of accepted offers divided by the number of offers sent, expressed as a percentage. The terms are used interchangeably across recruiting literature.
Is a 30% acceptance rate high?
Running a short audit of your most recent declines, tagged by reason, is the fastest way to identify the dominant cause.
Sources
Recommended


News & Updates
Stay up-to-date with the latest innovations, features, and tips about Recruitify!
By providing your email address within the newsletter sign-up form, you confirm its processing to send marketing information regarding the Administrator’s products and services. The Administrator of your personal data processed for the abovementioned purposes is Recruitify Spółka z o.o., based in Warsaw, Poland (KRS 0000709889). For more information on the principles of personal data processing and the rights of data subjects, please check the Privacy Policy.

Last updated:
Offer Acceptance Rate for HR Teams: Why Faster Offers Still Fail
Recruitment Process
The Recruitify Team
Offer acceptance rate measures the share of job offers candidates accept, calculated as (offers accepted divided by offers sent) multiplied by 100. There is no single universal benchmark because the figure shifts by role, seniority, and market conditions, but it remains one of the clearest signals of whether your compensation, speed, and candidate experience are working together or against each other.
RecruitifyKeep Offers Moving With RecruitifyRecruitify brings sales and recruitment pipelines together, with workflow automation to help IT recruitment teams manage offers and placements.Explore Recruitify
Key Takeaways
Improving offer acceptance rates requires faster offers, better candidate engagement, and precise data tracking, as acceptance is a key indicator of recruitment success.
Point | Details |
|---|---|
Speed of offer process | Compress the timeline from final interview to offer to increase candidate acceptance and improve recruitment flow. |
Present full rewards | Clearly communicate total compensation, including base, bonus, benefits, and growth prospects, during the offer stage. |
Capture candidate signals | Use pre-offer check-ins to identify candidate concerns early and address objections before they lead to declines. |
Personalized communication | Use high-touch outreach, such as phone calls from hiring managers, especially for senior roles, to boost acceptance. |
Automate and track recruiting data | Leverage automation tools for follow-ups and use detailed segmentation to identify weak spots and inform tactics. |
Table of Contents
What offer acceptance rate measures and why it matters
How to calculate offer acceptance rate, including edge cases
What data fields you need and how to segment the metric
Benchmarks and how to interpret your acceptance rate
Common reasons candidates decline offers
Prioritized tactics to increase offer acceptance rate
How to measure, report, and track progress
Applied example: what automation changes at offer stage
Common calculation mistakes and how to avoid them
Related metrics to track alongside offer acceptance rate
What we’ve learned about raising acceptance rates
How Recruitify helps you close more offers, faster
FAQ
Sources
What offer acceptance rate measures and why it matters
Offer acceptance rate is a lagging indicator of almost everything that happened earlier in your hiring process. A low number rarely means candidates suddenly disliked your offer letter. It usually means compensation lagged the market, the process dragged long enough for a competitor to move faster, or the candidate experience left doubts that surfaced right before signing.
The business cost compounds quickly when acceptance rates slip. Every declined offer means restarting part of the pipeline, which lengthens time-to-fill, consumes recruiter capacity, and often forces hiring managers to settle for a weaker runner-up candidate or leave a seat empty while revenue-generating work waits.
That said, acceptance rate deserves priority attention mainly when your upstream metrics are healthy. If your interview-to-offer ratio is already weak, fixing that funnel stage usually produces a bigger return than optimizing the final step. Acceptance rate becomes the right lever to pull when:
Your pipeline consistently produces qualified finalists but offers stall at the finish line.
Time-to-offer has crept upward relative to your market’s hiring pace.
Recruiters report candidates citing competing offers or compensation gaps during final-stage conversations.
How to calculate offer acceptance rate, including edge cases
The canonical formula is straightforward: Offer Acceptance Rate = (Offers Accepted ÷ Offers Sent) × 100. The complexity lives in deciding what counts as “sent” and what counts as “accepted.”
Count an offer as “sent” only once it reaches the candidate formally, not when a hiring manager verbally floats a number.
Count an offer as “accepted” only when the candidate confirms in writing, not when they verbally agree pending negotiation.
Exclude withdrawn offers (pulled by the employer before a candidate responds) from the denominator entirely, since the candidate never had a chance to decide.
Treat conditional offers, those pending background checks or references, as pending until the condition resolves; do not count them as accepted until confirmed.
Flag reneges (candidates who accept, then back out before start date) separately from declines, since they distort both acceptance rate and workforce planning if blended together.
A worked example: your team sends 40 offers in a quarter. Thirty-two candidates accept in writing, five decline outright, and three are withdrawn by your hiring managers before a response. Drop a formula into a spreadsheet column next to your offer log and it updates automatically as new rows come in.
What data fields you need and how to segment the metric
Accurate acceptance rate tracking depends on capturing the right fields at the moment an offer is extended, not reconstructing them later from memory or email threads.
Offer sent date: the timestamp an offer formally reaches the candidate, which anchors your time-to-offer calculations too.
Status: accepted, declined, withdrawn, conditional-pending, or renege, kept as distinct values rather than a single “closed” flag.
Role and role family: engineering, sales, operations, and so on, since acceptance behavior varies sharply across functions.
Seniority level: individual contributor, manager, director, executive, because negotiation dynamics differ by level.
Source: inbound application, recruiter sourced, referral, or agency, to see which channels produce offers that stick.
Offered compensation: base, bonus, and equity where applicable, so you can later correlate pay positioning with decline patterns.
Segment your dashboard by role family, level, hiring team, source, geography, and time period so a strong aggregate number cannot hide a weak segment.
Pro Tip: Automate status updates directly from your applicant tracking system instead of relying on recruiters to log outcomes manually, since manual logs are the most common source of missing or stale offer-status data.
Benchmarks and how to interpret your acceptance rate
Published benchmarks vary widely because sample sets differ by industry, geography, and seniority mix, so treat any single figure as a reference point rather than a target to hit exactly. Statista’s technology talent series tracks offer-acceptance success rates specifically for technology roles, which is a useful comparison if your hiring mix skews toward engineering and IT talent, but it will understate or overstate your real position if your roles sit outside that category.
Candidates now routinely weigh multiple offers at once. Gartner’s first-quarter 2025 research found that 44% of prospective candidates received multiple job offers in that quarter, and 53% of candidates cited higher compensation as their main decision driver when choosing among them. A candidate weighing two or three live offers is a candidate who will decline yours the moment your compensation or timeline falls short.
Adjust your expectations by level. Entry-level and mid-level individual contributor roles typically see higher acceptance because fewer competing offers exist at that volume. Senior, specialized, and executive roles see more volatility because the candidate pool is smaller and each person is more likely to be courted elsewhere simultaneously.
Build internal benchmark bands instead of chasing an external number: track your own acceptance rate by role family over the last four quarters, set a realistic improvement target of a few percentage points per segment, and treat any segment below your internal median as a priority for the tactics below.
Common reasons candidates decline offers
A structured decline audit beats guesswork. Before changing anything, review your last 15 to 20 declined offers and tag each by primary reason.
Compensation gap: the offered package fell short of market rate or the candidate’s current comp.
Competing offer: the candidate accepted or was close to accepting elsewhere, often one that moved faster.
Unclear role expectations: the candidate felt uncertain about scope, reporting lines, or growth path even after interviews.
Timing mismatch: start date, notice period, or offer-to-decision window didn’t fit the candidate’s situation.
Poor process experience: slow communication, disorganized interviews, or inconsistent messaging eroded trust before the offer even arrived.
Interview-stage signals often predict a decline before it happens: a candidate who goes quiet between rounds, asks pointed questions about other active processes, or hesitates on availability for a final interview is telling you something. Run a seven-day audit on a rolling basis: pull every decline from the past week, have the assigned recruiter log the primary reason in a shared field, and review patterns at your weekly team meeting rather than letting individual declines disappear into anecdote.
Prioritized tactics to increase offer acceptance rate
Not every lever deserves equal attention. Work through these in order, since speed and signal capture tend to produce the fastest measurable gains.
Compress your offer timeline first. Candidate experience benchmark research from ERE found that 64% of candidates waited less than a week between their final interview and receiving an offer, and companies that hit that window saw stronger referral and relationship outcomes. Set an internal target of five business days from final interview to offer, and automate the handoff between interview feedback collection and offer drafting so it doesn’t wait on a single manager’s calendar.
Frame total rewards, not just base salary. Given that compensation was the top decision driver for 53% of candidates in Gartner’s 1Q25 research, present the full package, bonus structure, equity, benefits, and growth trajectory, in the offer conversation itself rather than burying it in a PDF the candidate reads alone.
Capture interview signals before you write the offer. A short structured pre-offer check-in, where the recruiter directly asks about competing processes, timeline pressure, and remaining concerns, lets you address objections before they turn into a decline. This is cheaper than renegotiating after the fact.
Personalize the outreach at offer stage. A phone call from the hiring manager carries more weight than an automated email, especially for senior roles. Reserve the high-touch version for your highest-priority hires and automate the rest.
Build a negotiation playbook for common counteroffers. Pre-approve ranges for base, sign-on bonus, and start-date flexibility so recruiters can respond within hours instead of escalating through three layers of approval while the candidate’s other offer deadline passes.
Fix the operational layer underneath everything else. Maintain warm talent pools so you’re not starting from zero when a role reopens, automate offer-stage follow-ups so no candidate waits in silence, and assign clear process ownership so no offer sits unanswered because two people assumed the other was handling it.
Pro Tip: Give every open requisition a single named owner for the offer stage specifically, separate from the sourcing owner, so accountability for speed never falls between two people.
How to measure, report, and track progress
Treat acceptance rate as a dashboard metric with multiple slices, not a single quarterly number buried in a slide deck.
Acceptance rate by role family and level, updated at least monthly, to catch segment-level weakness early.
Acceptance rate by source, so you can see whether referrals, agency submissions, or inbound applicants convert differently at offer stage.
Acceptance rate by recruiter and hiring team, used developmentally rather than punitively, to spot where coaching or process support would help.
Time-to-offer trend, tracked alongside acceptance rate since the two usually move together.
While running any intervention, watch leading indicators before the acceptance number itself moves: time spent in each interview stage, candidate satisfaction scores collected right after the offer conversation, and the frequency of positive signal flags from your pre-offer check-ins.
Dashboard slice | What it reveals | Suggested review cadence |
|---|---|---|
Acceptance rate by role family | Which functions are losing candidates at offer stage | Monthly |
Acceptance rate by source | Which sourcing channels produce offers that stick | Monthly |
Time-to-offer by team | Where delays are concentrated | Weekly |
Decline reason tags | Root causes behind lost offers | Weekly |
Run interventions as small, time-boxed experiments, change one variable, such as offer timeline or compensation framing, for one segment over a single quarter, then compare against your historical baseline before rolling it out company-wide.
Applied example: what automation changes at offer stage
A recurring pattern among agencies that consolidate their recruitment workflow into a single system is a meaningful jump in candidate throughput without adding headcount. Recruitify’s own case study on moving from spreadsheets to automation describes a recruitment agency that increased the number of presented candidates after replacing scattered spreadsheets with automated workflows and an organized talent pool.
Consolidating candidate data into searchable talent pools, automating offer-stage follow-ups, and maintaining a GDPR consent audit trail let the team present more candidates without expanding the recruiter headcount.
The workflows that mattered most were talent pool reactivation, which let the agency resurface previously sourced candidates instead of starting sourcing from zero, and automated follow-up sequencing, which kept candidates informed between interview and offer instead of leaving them in silence. A practical first pilot: audit your own dormant candidate database for one role family and measure how many previously screened candidates could re-enter an active pipeline this month.
Common calculation mistakes and how to avoid them
Small counting errors produce big misreads. Avoid these before trusting your dashboard.
Counting withdrawn offers as declines: this understates your true acceptance rate, since the candidate never got to choose.
Counting conditional offers as accepted before conditions clear: this inflates your number temporarily, then creates confusing reversals later.
Mixing internal transfers with external hires: internal moves almost always accept, which artificially inflates your blended rate.
Drawing conclusions from small samples: a single department with five offers in a quarter can swing from 60% to 100% on one decision, so treat low-volume segments with wider margins before reacting.
Ignoring seasonal patterns: acceptance rates often dip around major holiday periods or fiscal year-end, so compare year-over-year periods, not just adjacent quarters.
Before presenting any number, run a quick checklist: confirm withdrawn offers are excluded from the denominator, confirm conditional offers are marked pending, and confirm your sample size supports the conclusion you’re drawing.
Related metrics to track alongside offer acceptance rate
Offer acceptance rate tells a fuller story when paired with metrics that explain the “why” behind the number.
Time-to-offer and time-to-hire: these reveal whether speed, or the lack of it, is driving declines.
Offer decline reasons, captured qualitatively from every decline rather than inferred, to catch patterns before they become trends.
Candidate experience and hiring manager satisfaction scores, which surface friction points earlier in the funnel that eventually show up as offer-stage losses.
What we’ve learned about raising acceptance rates
Our view, after working closely with recruitment teams on this problem, is that speed beats almost every other lever. A fast, well-communicated offer consistently outperforms a slightly better-paying one that arrives a week late. Second, data hygiene matters more than most teams admit: you cannot fix what you aren’t accurately measuring at the status level. Third, automation isn’t a shortcut around good recruiting judgment, it’s what frees recruiters to use that judgment at the moments that actually decide whether a candidate signs.
- Recruitify Team
How Recruitify helps you close more offers, faster
We built our platform to remove the operational drag that slows offers down. Our contextual matching AI surfaces ready shortlists from your existing talent pools, so you’re not restarting sourcing every time a role opens. Our automation engine handles offer-stage follow-ups and status tracking, keeping candidates informed and your dashboard accurate without manual logging. Our GDPR consent audit trail keeps your data clean and defensible as you scale.
Talent pool reactivation to shorten time-to-offer.
Automated follow-up sequencing so no candidate waits in silence.
Full audit trail for every candidate record, built for compliance and reporting.
If you’re ready to see these workflows in your own pipeline, check our pricing plans, including the HR Team and Recruitment Agencies tiers, and request a walkthrough.
FAQ
Is acceptance rate the same as offer rate?
No. Offer acceptance rate measures the share of extended offers that candidates accept, while offer rate typically refers to the share of interviewed or final-stage candidates who receive an offer in the first place. They measure different stages of the same funnel.
What does “offer rate” mean?
Offer rate describes how often your hiring process results in an extended offer, usually calculated as offers made divided by candidates who reached the final interview stage. It’s an upstream metric that precedes acceptance rate rather than a substitute for it.
What is the offer acceptance ratio?
The offer acceptance ratio is another name for offer acceptance rate: the number of accepted offers divided by the number of offers sent, expressed as a percentage. The terms are used interchangeably across recruiting literature.
Is a 30% acceptance rate high?
Running a short audit of your most recent declines, tagged by reason, is the fastest way to identify the dominant cause.
Sources
Recommended
News & Updates
Stay up-to-date with the latest innovations, features, and tips about Recruitify!
By providing your email address within the newsletter sign-up form, you confirm its processing to send marketing information regarding the Administrator’s products and services. The Administrator of your personal data processed for the abovementioned purposes is Recruitify Spółka z o.o., based in Warsaw, Poland (KRS 0000709889). For more information on the principles of personal data processing and the rights of data subjects, please check the Privacy Policy.

Discover More

Recruitment Process
Rate Card Staffing: How to Build, Price and Manage One
A practical guide to staffing rate cards: how bill rates are built from pay rates, which methodology to use, how to review rates, and how to manage them.
25 Oct 2026
Discover More

Innovations
Application Conversion Rate: Formula, Benchmarks, Fixes
Application conversion rate explained for recruiters: the formula, stage-by-stage math, real benchmarks, and the fixes that move the number. Includes app-store rates.
24 Oct 2026
Discover More

Recruitment Process
GDPR-Compliant Analytics for Recruitment Teams
What makes analytics GDPR compliant, from cookies to candidate data: a practical framework for recruitment agencies and HR teams, including US firms hiring in the EU.
23 Oct 2026
Discover More
Recruitment Process
Rate Card Staffing: How to Build, Price and Manage One
A practical guide to staffing rate cards: how bill rates are built from pay rates, which methodology to use, how to review rates, and how to manage them.
25 Oct 2026
Discover More
Innovations
Application Conversion Rate: Formula, Benchmarks, Fixes
Application conversion rate explained for recruiters: the formula, stage-by-stage math, real benchmarks, and the fixes that move the number. Includes app-store rates.
24 Oct 2026
Discover More