
Last updated:
Application Conversion Rate: Formula, Benchmarks, Fixes

Innovations

The Recruitify Team
Application conversion rate is the share of people who complete a desired step out of everyone who had the chance to take it. In recruitment, that usually means the percentage of job viewers who submit an application, or the percentage of applicants who advance to the next stage. In mobile marketing, the same phrase means the share of store visitors who install an app. This guide covers both meanings, then goes deep on the recruiting one: how to calculate it, what the benchmarks say, and what to change when your number is low.
Key takeaways
The formula is always the same: people who completed the step, divided by people who could have, times 100. What changes is the denominator, and that choice decides whether your number is useful.
In recruiting, track conversion per stage (view to apply, apply to screen, screen to interview, interview to offer, offer to hire) rather than one blended figure.
Published benchmarks are directional. Use them to decide where to investigate, not as a target to hit.
A higher application rate is not automatically better. If quality drops, you have only moved the bottleneck to your recruiters.
Fixing the stages manually is slow. Automating parsing, scoring and status updates is where most agencies recover time and candidates.
Table of Contents
Two meanings of the same phrase
Search results for this term mix two different worlds, so it helps to separate them before any math.
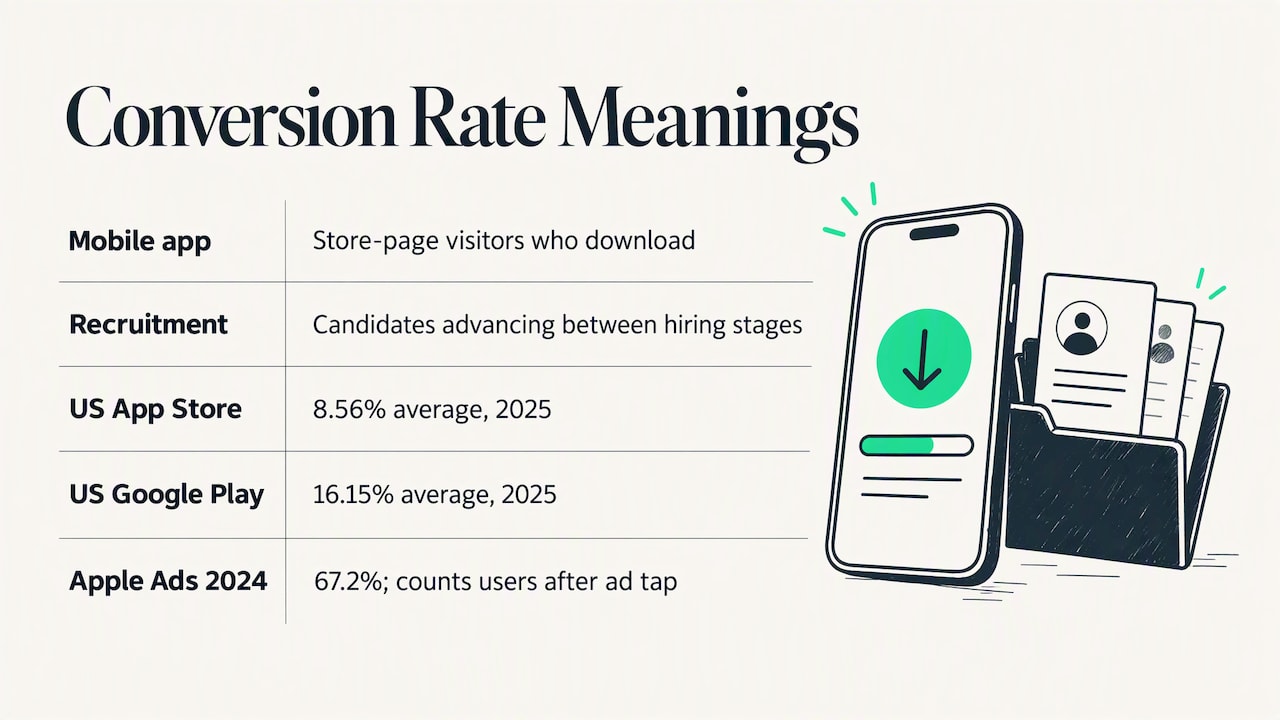
Mobile app conversion rate. Marketers define it as the proportion of store visitors who download an app after viewing its page. AppTweak’s 2025 benchmarks put the average in the US at 8.56% on the App Store and 16.15% on Google Play, with huge variation by category: from 52.8% for Food & Drink down to 5.2% for Games - Trivia on the App Store. Paid traffic behaves differently. A SplitMetrics report on Apple Ads Search Results covering 2024 shows an average conversion rate of 67.2% across the top categories, but that figure counts only users who already tapped an ad, so it must not be compared with organic store rates.
The denominator matters even inside one platform. Apple defines conversion rate as total downloads and pre-orders divided by unique device impressions, and notes that its peer group benchmarks show whether your results are typical, above average or lagging, while remaining directional rather than an exact ranking of competitors.
Recruitment application conversion rate. This is the percentage of candidates who move from one stage of a hiring process to the next, starting with the moment they see a job and decide whether to apply. It is a core funnel KPI for agencies, in-house talent acquisition teams and freelance recruiters. The rest of this article is about this meaning.
How to calculate application conversion rate in recruiting
The general formula:
Conversion rate = (candidates who reached the next stage ÷ candidates who entered the current stage) × 100
There are three versions worth tracking, and they answer different questions.
Apply rate (top of funnel). Applications submitted divided by job page views or ad clicks. It measures how persuasive your job ad, careers page and application form are.
Stage-to-stage conversion. Candidates who advance divided by candidates who entered the stage. It shows exactly where people are lost or rejected.
Overall application-to-hire rate. Hires divided by total applications. It is the least diagnostic but the easiest to report to a client or a hiring manager.
Pick the denominator deliberately. If you divide applications by unique visitors in one report and by total sessions in another, the two numbers are not comparable, and a team that changes definitions mid-year will believe it improved when it did not.
A worked example
The numbers below are illustrative, not benchmarks. Imagine one senior backend developer role over a month:
Stage | Candidates entering | Candidates advancing | Conversion |
|---|---|---|---|
Job page view to application | 2,400 views | 120 applications | 5.0% |
Application to recruiter screen | 120 | 30 | 25.0% |
Screen to client interview | 30 | 9 | 30.0% |
Interview to offer | 9 | 3 | 33.3% |
Offer to accepted hire | 3 | 2 | 66.7% |
The overall application-to-hire rate is 2 ÷ 120, or 1.7%. That single figure hides the useful story: the top of the funnel looks healthy, but only a quarter of applicants reach a screen. Either the ad attracts the wrong audience or the screening step is slow and candidates disengage. You can only tell by looking at stages, and by checking how long each application waits before anyone responds.
What the benchmarks say
Benchmarks for apply rates come from job advertising data. The Appcast 2025 Recruitment Marketing Benchmark Report analyzed 2024 job ad data from more than 1,300 US employers, covering 379 million clicks and over 30 million applies. In that data, technology roles had the highest apply rate at 6.41%, followed by marketing and advertising at 6.31% and business and consumer services at 6.29%.
Two cautions apply when you read those numbers.
They measure paid clicks. The report only includes ads bought on a cost-per-click or cost-per-application basis, so your organic careers page or a direct outreach campaign may behave differently.
They are averages across employers. An agency recruiting niche IT contractors for a specific stack faces a different candidate market from a retailer hiring seasonal staff.
So what is a good conversion rate? There is no universal answer, and the people-also-ask questions about 10%, 12% or 30% being “good” cannot be settled without a stage and a denominator. A 30% rate from screen to interview can be strong, while 30% from view to apply would suggest a very narrow, pre-qualified audience, or a miscounted denominator. The useful approach, which Apple’s guidance on peer benchmarks also reflects, is to treat a benchmark as the start of a diagnosis. If you sit well below peers at one stage, investigate that stage. If you sit above, check that quality has not fallen.
Why apply rate alone can mislead
A higher application rate is attractive because it is easy to measure. But consider what happens when you shorten the form, enable one-click apply and broaden the job title. Applications rise, and so does the volume of poorly matched candidates. The apply rate improves while the screen-to-interview rate falls, and recruiters spend more hours on every placement.
The right companion metrics are:
Qualified application rate: the share of applications that meet your must-have criteria.
Time to first response: hours between application and first human or automated contact.
Drop-off rate inside the form: how many candidates start but do not finish.
Source quality: conversion from application to interview by channel, not just volume by channel.
For a deeper look at which funnel measures predict outcomes, see our guide to recruitment funnel metrics that predict hires.
How to improve application conversion rate
Work from the top of the funnel down, and change one variable at a time so you can attribute the result.
1. Fix the job ad first
State the stack, seniority, rate or salary range, location or remote policy, and contract type in the first lines. IT candidates skim for exactly those details. Vague ads attract broad applicants and repel specialists who assume the role is generic.
2. Shorten the path to apply
Count the clicks and fields between the job page and a completed submission. Ask only for what you need to make a first decision, and let candidates upload a CV instead of retyping it. Test on a phone, since many candidates will first open your ad there.
3. Respond quickly and visibly
Silence after applying is a major cause of mid-funnel loss. An automatic acknowledgement with a realistic timeline, followed by a human update within a few days, keeps candidates engaged, especially in markets where developers hold several processes at once.
4. Screen on context, not keywords
Keyword filters reject strong people whose CVs use different wording and pass weak ones who copied the job ad. Scoring that understands how technologies relate to each other produces a shortlist you can trust, which raises the screen-to-interview rate without raising workload.
5. Measure by source and by recruiter
If one job board produces three times the applications but half the interviews, its apply rate is flattering you. Compare sources on application-to-interview and interview-to-hire conversion before you decide where to spend budget.
6. Reuse the candidates you already have
Most agencies hold thousands of past applicants who were never contacted again. A new role in a familiar stack is often cheaper to fill from that pool than from a new advertisement, and it creates applications with a much higher chance of converting. This depends on a searchable, deduplicated database. Our article on moving from manual processes to a modern recruitment workflow explains how to get there in stages.
Where the hours go: the administrative drag on conversion
Conversion at each stage is partly a function of speed. Recruiters who retype CV data into records, hunt through spreadsheets for a past candidate, or chase hiring managers for feedback respond later, and later responses convert worse. The fix is a process problem as much as a people problem, and the first step is to confirm that your tools form a system rather than a pile of separate screens. We discuss this distinction in why having an ATS does not mean you have a recruitment system.
A practical audit takes an afternoon:
Export the last 90 days of applications with timestamps for each stage change.
Calculate the stage-to-stage conversion and the median time spent in each stage.
Mark the two stages with the longest waits and the lowest conversion.
List every manual task in those stages (data entry, duplicate checks, status emails, shortlist building).
Automate or remove the heaviest one, then re-measure after 30 days.
If you want to see how stage automation is structured for agencies, read about recruitment workflow automation and how analytics supports data-driven hiring decisions.
Our perspective
We work with IT recruitment agencies and in-house teams, and the pattern we see most often is not a weak top of the funnel. It is a funnel that leaks in the middle because the team cannot process what arrives fast enough. The question we encourage owners to ask is not “how do we get more applications?” but “how many of the applications we already have did we handle well?”
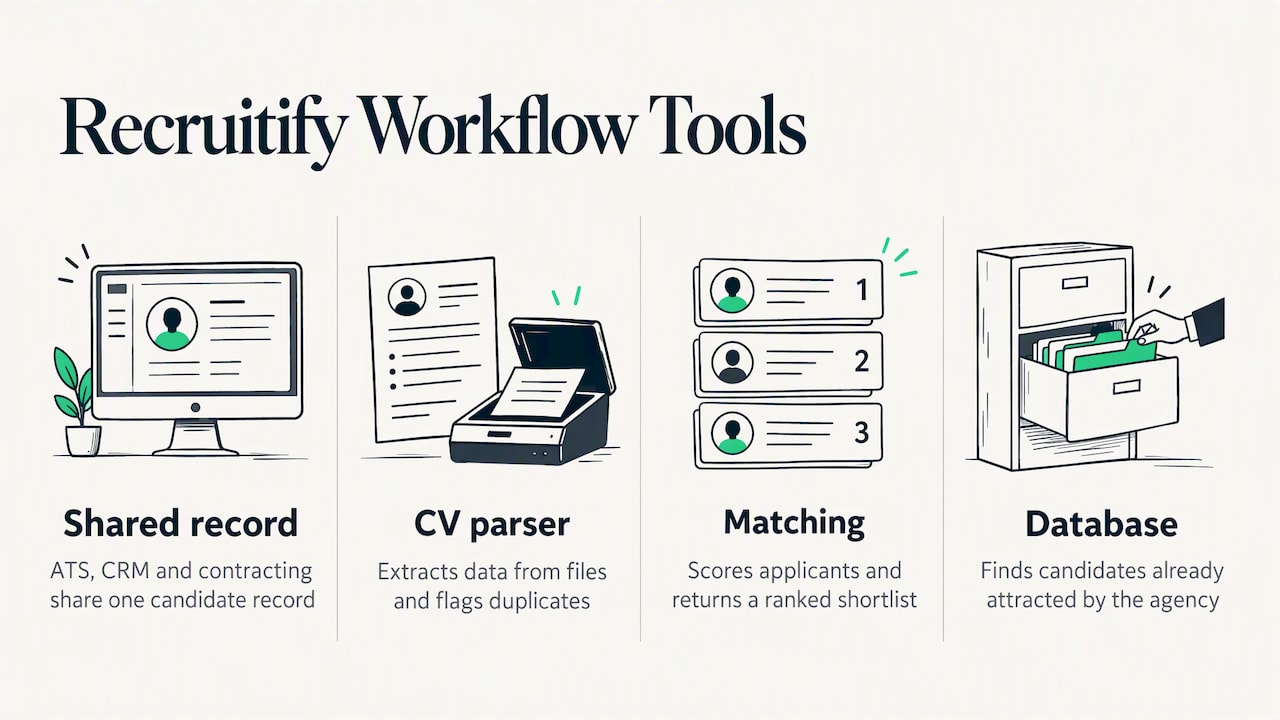
That is why we built Recruitify around a single workspace where the ATS, the sales CRM and the contracting module share one candidate record. The AI CV parser extracts structured data from PDFs, DOCX files, scans and photos and flags duplicates, so a profile exists seconds after an application lands. Contextual matching scores applicants against project requirements and returns a shortlist with a percentage match, so recruiters start from a ranked list instead of a pile. Indexing the existing database lets an agency find candidates it already paid to attract. Our own claim is that this can reduce administrative work by 70%, and the practical effect on conversion is simple: faster responses, better shortlists and fewer candidates lost to delay.
We also think benchmarks should be handled with restraint. A number from a report tells you whether to look closer, never what is wrong. The honest measure is the quality of hires per hour of recruiter time, and conversion rates are the instrument that lets you find where that time is wasted.
- Recruitify Team
See your funnel in one place
If your stage-by-stage numbers are scattered across spreadsheets, job boards and an ATS that does not talk to your CRM, the first benefit of consolidating is visibility. Recruitify’s candidate database and ATS gives each recruiter one pipeline view, and the AI recruitment features handle parsing and scoring. Plans are listed on the pricing page: HR Team is €61 per user per month, Agency is €67 per user per month, and Enterprise is priced on request. For an example of the change in practice, see how a recruitment agency moved from spreadsheets to automation.
FAQ
What is a good application conversion rate?
It depends on the stage and the denominator. For job views to applications, published paid-ad data from Appcast shows technology roles at about 6.41% in 2024. For later stages, compare against your own history and your own sources first, since industry averages mix very different hiring markets.
Is a 10% or 30% conversion rate good?
Neither number is good or bad on its own. A 10% apply rate from views would be high for most paid job ads, while a 30% rate from screen to interview could be ordinary. Always state which two counts you divided, and compare like with like.
How is application conversion rate different from the conversion rate of a mobile app?
A mobile app conversion rate usually divides installs by store page visitors, and averages vary widely by store and category, as the AppTweak benchmarks show. A recruitment rate divides candidates who advance by candidates who entered a stage. The formula is identical, but the benchmarks are not interchangeable.
Should I try to maximize the apply rate?
Not on its own. Raising it by removing every barrier can flood recruiters with unqualified applicants and lower your later-stage conversion. Track the qualified application rate and time to first response together with the apply rate.
Sources
SplitMetrics: Apple Ads Search Results Benchmarks Report 2025
Apple Developer: Peer group benchmarks in App Store Connect Analytics
Recommended
Offer Acceptance Rate for HR Teams: Why Faster Offers Still Fail
Zero Candidate Loss When Switching ATS: A 6-Step Guide for Recruiters
Track 5 Recruitment Funnel Metrics That Predict Hires for TA Teams
44 Day Benchmark: Time to Hire Targets and 90 Day Plan for Recruiters


News & Updates
Stay up-to-date with the latest innovations, features, and tips about Recruitify!
By providing your email address within the newsletter sign-up form, you confirm its processing to send marketing information regarding the Administrator’s products and services. The Administrator of your personal data processed for the abovementioned purposes is Recruitify Spółka z o.o., based in Warsaw, Poland (KRS 0000709889). For more information on the principles of personal data processing and the rights of data subjects, please check the Privacy Policy.

Last updated:
Application Conversion Rate: Formula, Benchmarks, Fixes
Innovations
The Recruitify Team
Application conversion rate is the share of people who complete a desired step out of everyone who had the chance to take it. In recruitment, that usually means the percentage of job viewers who submit an application, or the percentage of applicants who advance to the next stage. In mobile marketing, the same phrase means the share of store visitors who install an app. This guide covers both meanings, then goes deep on the recruiting one: how to calculate it, what the benchmarks say, and what to change when your number is low.
Key takeaways
The formula is always the same: people who completed the step, divided by people who could have, times 100. What changes is the denominator, and that choice decides whether your number is useful.
In recruiting, track conversion per stage (view to apply, apply to screen, screen to interview, interview to offer, offer to hire) rather than one blended figure.
Published benchmarks are directional. Use them to decide where to investigate, not as a target to hit.
A higher application rate is not automatically better. If quality drops, you have only moved the bottleneck to your recruiters.
Fixing the stages manually is slow. Automating parsing, scoring and status updates is where most agencies recover time and candidates.
Table of Contents
Two meanings of the same phrase
Search results for this term mix two different worlds, so it helps to separate them before any math.
Mobile app conversion rate. Marketers define it as the proportion of store visitors who download an app after viewing its page. AppTweak’s 2025 benchmarks put the average in the US at 8.56% on the App Store and 16.15% on Google Play, with huge variation by category: from 52.8% for Food & Drink down to 5.2% for Games - Trivia on the App Store. Paid traffic behaves differently. A SplitMetrics report on Apple Ads Search Results covering 2024 shows an average conversion rate of 67.2% across the top categories, but that figure counts only users who already tapped an ad, so it must not be compared with organic store rates.
The denominator matters even inside one platform. Apple defines conversion rate as total downloads and pre-orders divided by unique device impressions, and notes that its peer group benchmarks show whether your results are typical, above average or lagging, while remaining directional rather than an exact ranking of competitors.
Recruitment application conversion rate. This is the percentage of candidates who move from one stage of a hiring process to the next, starting with the moment they see a job and decide whether to apply. It is a core funnel KPI for agencies, in-house talent acquisition teams and freelance recruiters. The rest of this article is about this meaning.
How to calculate application conversion rate in recruiting
The general formula:
Conversion rate = (candidates who reached the next stage ÷ candidates who entered the current stage) × 100
There are three versions worth tracking, and they answer different questions.
Apply rate (top of funnel). Applications submitted divided by job page views or ad clicks. It measures how persuasive your job ad, careers page and application form are.
Stage-to-stage conversion. Candidates who advance divided by candidates who entered the stage. It shows exactly where people are lost or rejected.
Overall application-to-hire rate. Hires divided by total applications. It is the least diagnostic but the easiest to report to a client or a hiring manager.
Pick the denominator deliberately. If you divide applications by unique visitors in one report and by total sessions in another, the two numbers are not comparable, and a team that changes definitions mid-year will believe it improved when it did not.
A worked example
The numbers below are illustrative, not benchmarks. Imagine one senior backend developer role over a month:
Stage | Candidates entering | Candidates advancing | Conversion |
|---|---|---|---|
Job page view to application | 2,400 views | 120 applications | 5.0% |
Application to recruiter screen | 120 | 30 | 25.0% |
Screen to client interview | 30 | 9 | 30.0% |
Interview to offer | 9 | 3 | 33.3% |
Offer to accepted hire | 3 | 2 | 66.7% |
The overall application-to-hire rate is 2 ÷ 120, or 1.7%. That single figure hides the useful story: the top of the funnel looks healthy, but only a quarter of applicants reach a screen. Either the ad attracts the wrong audience or the screening step is slow and candidates disengage. You can only tell by looking at stages, and by checking how long each application waits before anyone responds.
What the benchmarks say
Benchmarks for apply rates come from job advertising data. The Appcast 2025 Recruitment Marketing Benchmark Report analyzed 2024 job ad data from more than 1,300 US employers, covering 379 million clicks and over 30 million applies. In that data, technology roles had the highest apply rate at 6.41%, followed by marketing and advertising at 6.31% and business and consumer services at 6.29%.
Two cautions apply when you read those numbers.
They measure paid clicks. The report only includes ads bought on a cost-per-click or cost-per-application basis, so your organic careers page or a direct outreach campaign may behave differently.
They are averages across employers. An agency recruiting niche IT contractors for a specific stack faces a different candidate market from a retailer hiring seasonal staff.
So what is a good conversion rate? There is no universal answer, and the people-also-ask questions about 10%, 12% or 30% being “good” cannot be settled without a stage and a denominator. A 30% rate from screen to interview can be strong, while 30% from view to apply would suggest a very narrow, pre-qualified audience, or a miscounted denominator. The useful approach, which Apple’s guidance on peer benchmarks also reflects, is to treat a benchmark as the start of a diagnosis. If you sit well below peers at one stage, investigate that stage. If you sit above, check that quality has not fallen.
Why apply rate alone can mislead
A higher application rate is attractive because it is easy to measure. But consider what happens when you shorten the form, enable one-click apply and broaden the job title. Applications rise, and so does the volume of poorly matched candidates. The apply rate improves while the screen-to-interview rate falls, and recruiters spend more hours on every placement.
The right companion metrics are:
Qualified application rate: the share of applications that meet your must-have criteria.
Time to first response: hours between application and first human or automated contact.
Drop-off rate inside the form: how many candidates start but do not finish.
Source quality: conversion from application to interview by channel, not just volume by channel.
For a deeper look at which funnel measures predict outcomes, see our guide to recruitment funnel metrics that predict hires.
How to improve application conversion rate
Work from the top of the funnel down, and change one variable at a time so you can attribute the result.
1. Fix the job ad first
State the stack, seniority, rate or salary range, location or remote policy, and contract type in the first lines. IT candidates skim for exactly those details. Vague ads attract broad applicants and repel specialists who assume the role is generic.
2. Shorten the path to apply
Count the clicks and fields between the job page and a completed submission. Ask only for what you need to make a first decision, and let candidates upload a CV instead of retyping it. Test on a phone, since many candidates will first open your ad there.
3. Respond quickly and visibly
Silence after applying is a major cause of mid-funnel loss. An automatic acknowledgement with a realistic timeline, followed by a human update within a few days, keeps candidates engaged, especially in markets where developers hold several processes at once.
4. Screen on context, not keywords
Keyword filters reject strong people whose CVs use different wording and pass weak ones who copied the job ad. Scoring that understands how technologies relate to each other produces a shortlist you can trust, which raises the screen-to-interview rate without raising workload.
5. Measure by source and by recruiter
If one job board produces three times the applications but half the interviews, its apply rate is flattering you. Compare sources on application-to-interview and interview-to-hire conversion before you decide where to spend budget.
6. Reuse the candidates you already have
Most agencies hold thousands of past applicants who were never contacted again. A new role in a familiar stack is often cheaper to fill from that pool than from a new advertisement, and it creates applications with a much higher chance of converting. This depends on a searchable, deduplicated database. Our article on moving from manual processes to a modern recruitment workflow explains how to get there in stages.
Where the hours go: the administrative drag on conversion
Conversion at each stage is partly a function of speed. Recruiters who retype CV data into records, hunt through spreadsheets for a past candidate, or chase hiring managers for feedback respond later, and later responses convert worse. The fix is a process problem as much as a people problem, and the first step is to confirm that your tools form a system rather than a pile of separate screens. We discuss this distinction in why having an ATS does not mean you have a recruitment system.
A practical audit takes an afternoon:
Export the last 90 days of applications with timestamps for each stage change.
Calculate the stage-to-stage conversion and the median time spent in each stage.
Mark the two stages with the longest waits and the lowest conversion.
List every manual task in those stages (data entry, duplicate checks, status emails, shortlist building).
Automate or remove the heaviest one, then re-measure after 30 days.
If you want to see how stage automation is structured for agencies, read about recruitment workflow automation and how analytics supports data-driven hiring decisions.
Our perspective
We work with IT recruitment agencies and in-house teams, and the pattern we see most often is not a weak top of the funnel. It is a funnel that leaks in the middle because the team cannot process what arrives fast enough. The question we encourage owners to ask is not “how do we get more applications?” but “how many of the applications we already have did we handle well?”
That is why we built Recruitify around a single workspace where the ATS, the sales CRM and the contracting module share one candidate record. The AI CV parser extracts structured data from PDFs, DOCX files, scans and photos and flags duplicates, so a profile exists seconds after an application lands. Contextual matching scores applicants against project requirements and returns a shortlist with a percentage match, so recruiters start from a ranked list instead of a pile. Indexing the existing database lets an agency find candidates it already paid to attract. Our own claim is that this can reduce administrative work by 70%, and the practical effect on conversion is simple: faster responses, better shortlists and fewer candidates lost to delay.
We also think benchmarks should be handled with restraint. A number from a report tells you whether to look closer, never what is wrong. The honest measure is the quality of hires per hour of recruiter time, and conversion rates are the instrument that lets you find where that time is wasted.
- Recruitify Team
See your funnel in one place
If your stage-by-stage numbers are scattered across spreadsheets, job boards and an ATS that does not talk to your CRM, the first benefit of consolidating is visibility. Recruitify’s candidate database and ATS gives each recruiter one pipeline view, and the AI recruitment features handle parsing and scoring. Plans are listed on the pricing page: HR Team is €61 per user per month, Agency is €67 per user per month, and Enterprise is priced on request. For an example of the change in practice, see how a recruitment agency moved from spreadsheets to automation.
FAQ
What is a good application conversion rate?
It depends on the stage and the denominator. For job views to applications, published paid-ad data from Appcast shows technology roles at about 6.41% in 2024. For later stages, compare against your own history and your own sources first, since industry averages mix very different hiring markets.
Is a 10% or 30% conversion rate good?
Neither number is good or bad on its own. A 10% apply rate from views would be high for most paid job ads, while a 30% rate from screen to interview could be ordinary. Always state which two counts you divided, and compare like with like.
How is application conversion rate different from the conversion rate of a mobile app?
A mobile app conversion rate usually divides installs by store page visitors, and averages vary widely by store and category, as the AppTweak benchmarks show. A recruitment rate divides candidates who advance by candidates who entered a stage. The formula is identical, but the benchmarks are not interchangeable.
Should I try to maximize the apply rate?
Not on its own. Raising it by removing every barrier can flood recruiters with unqualified applicants and lower your later-stage conversion. Track the qualified application rate and time to first response together with the apply rate.
Sources
SplitMetrics: Apple Ads Search Results Benchmarks Report 2025
Apple Developer: Peer group benchmarks in App Store Connect Analytics
Recommended
Offer Acceptance Rate for HR Teams: Why Faster Offers Still Fail
Zero Candidate Loss When Switching ATS: A 6-Step Guide for Recruiters
Track 5 Recruitment Funnel Metrics That Predict Hires for TA Teams
44 Day Benchmark: Time to Hire Targets and 90 Day Plan for Recruiters
News & Updates
Stay up-to-date with the latest innovations, features, and tips about Recruitify!
By providing your email address within the newsletter sign-up form, you confirm its processing to send marketing information regarding the Administrator’s products and services. The Administrator of your personal data processed for the abovementioned purposes is Recruitify Spółka z o.o., based in Warsaw, Poland (KRS 0000709889). For more information on the principles of personal data processing and the rights of data subjects, please check the Privacy Policy.

Discover More

Recruitment Process
Rate Card Staffing: How to Build, Price and Manage One
A practical guide to staffing rate cards: how bill rates are built from pay rates, which methodology to use, how to review rates, and how to manage them.
25 Oct 2026
Discover More

Recruitment Process
GDPR-Compliant Analytics for Recruitment Teams
What makes analytics GDPR compliant, from cookies to candidate data: a practical framework for recruitment agencies and HR teams, including US firms hiring in the EU.
23 Oct 2026
Discover More

Applicant Tracking System
EU AI Act and Recruitment: What Hiring Teams Must Do
How the EU AI Act treats recruitment AI: high-risk rules, the December 2027 deadline, deployer duties, US reach and a practical checklist for agencies.
22 Oct 2026
Discover More
Recruitment Process
Rate Card Staffing: How to Build, Price and Manage One
A practical guide to staffing rate cards: how bill rates are built from pay rates, which methodology to use, how to review rates, and how to manage them.
25 Oct 2026
Discover More
Recruitment Process
GDPR-Compliant Analytics for Recruitment Teams
What makes analytics GDPR compliant, from cookies to candidate data: a practical framework for recruitment agencies and HR teams, including US firms hiring in the EU.
23 Oct 2026
Discover More