
Last updated:
Track 5 Recruitment Funnel Metrics That Predict Hires for TA Teams

Recruitment Process

The Recruitify Team
Track five numbers every week: stage conversion rate, time-in-stage, source effectiveness, cost-per-hire, and offer acceptance. Layer quality of hire on top to confirm the funnel is producing the right outcomes, not just fast ones. Then apply one rule before anything else: find the earliest stage in your funnel where a large, controllable drop occurs, and fix that first. Benchmarks, a reusable template, and where automation genuinely helps all follow from that diagnostic habit based on your own data.
TL;DR:
Identifying and fixing the earliest stage with a large, controllable drop in the funnel provides the highest leverage for improving overall recruitment efficiency.
Benchmark data varies widely, but internal analysis over multiple quarters offers more accurate, role-specific baselines than relying solely on external averages.
Segmenting funnel metrics by role and source reveals bottlenecks, such as scheduling delays at interview stages or applicant mismatch at application, which require targeted fixes.
Automation of data collection, timestamping, and candidate deduplication improves accuracy in time-in-stage and source effectiveness metrics, while AI scoring supports diagnostic insights.
A focused dashboard with five to seven outcome metrics, refreshed weekly, enhances accountability and enables continuous improvement of recruitment processes.
RecruitifyTurn Funnel Data Into PlacementsRecruitify brings recruitment and sales workflows together, helping IT agencies reduce administrative work and identify stronger candidate matches.Explore Recruitify
Table of Contents
Recruitment Funnel Metrics: Core Definitions and Formulas
What Are Realistic Recruitment Funnel Benchmarks By Stage?
How Do You Diagnose Bottlenecks in Your Hiring Funnel?
Which Sourcing Channels Actually Produce Quality Hires?
Time-to-Fill vs. Time-to-Hire: What’s the Real Difference?
What Should a Recruiting Dashboard Actually Show?
How Automation Changes Funnel Measurement Without Replacing Judgment
Build Your Own Recruitment Funnel KPI Template
Common Measurement Mistakes We Keep Seeing
Automate the Measurement, Keep the Judgment: Recruitify for Funnel Analytics
Sources
FAQ
Recruitment Funnel Metrics: Core Definitions and Formulas
Recruitment funnel metrics measure how candidates move through your hiring process, from first click to accepted offer, and where they stop moving. The formulas are simple, but consistency in how you define each stage is what makes the numbers trustworthy across roles, teams, and quarters.
The foundational formula is the stage conversion rate: (candidates advancing ÷ candidates entering) × 100. Say 500 people view a job posting, 60 apply, 18 get screened, 6 reach an interview, and 2 receive an offer that gets accepted. Multiply those rates together and you get the overall pass-through rate, which tells you how many top-of-funnel candidates you need to produce one hire, a calculation covered in more detail in the stage conversion breakdown from HRHelperG.
Beyond the headline conversion number, a handful of sub-metrics deserve their own line in your tracker:
Application completion rate measures how many people who start an application actually submit it, a proxy for how much friction your careers page adds.
Screen-to-interview rate isolates recruiter judgment from sourcing quality, since it starts after the initial pool has already been filtered.
Interview-to-offer rate reflects hiring manager decisiveness and interview panel alignment.
Offer-to-accept rate captures competitiveness of compensation, timing, and candidate experience during negotiation.
Accept-to-start rate catches counteroffers, ghosting, and candidates who accept but never show up.
Time metrics run in parallel to conversion metrics and answer a different question: not “how many,” but “how long.” Time-in-stage is the median number of days a candidate sits in one specific stage before moving or dropping out. Time-to-fill counts days from requisition approval to accepted offer. Time-to-hire counts days from a candidate’s first application to their acceptance, a narrower window that reflects candidate experience more than internal process speed, a distinction Dayforce’s recruitment analytics research treats as essential rather than optional.
Quality metrics close the loop: quality of hire (often a 90-day performance or retention score), early turnover (departures inside the first six months), and hiring manager satisfaction (typically a post-hire survey score). Pull your raw numbers from ATS timestamps and job board analytics, but agree on stage definitions in writing first. A “screen” that means a recruiter call at one office and a hiring manager review at another will corrupt every downstream comparison.
What Are Realistic Recruitment Funnel Benchmarks By Stage?
Benchmark figures vary widely by source, role, and market, so treat every number below as a starting reference point, not a target to hit blindly.
Reported Stage Benchmarks: Click-to-apply conversion averages around 6%, application-to-interview around 3%, and interview-to-hire around 27%, according to recruitment funnel benchmark data. Offer acceptance typically lands between 85% and 92%. A separate set of published figures from Jobvite’s recruiting funnel benchmarks puts visitor-to-applicant conversion near 34.6%, application-to-interview near 8.4%, interview-to-offer near 36.2%, and offer-to-hire near 55.6%, with average time-to-hire around 43 days.
Notice how wide the spread is between those two benchmark sets, even for comparable stages. That gap is the point. Neither source is wrong. They are counting different funnel entry points and different candidate pools.
Several contextual factors move these numbers more than the benchmark source does:
Seniority compresses the funnel at senior levels, where fewer, more qualified candidates apply but conversion per stage tends to run higher.
Role function matters because technical and specialized roles often see lower apply rates but higher screen-to-interview conversion, since applicants tend to self-select more carefully.
Market tightness shifts offer acceptance directly. A candidate-scarce market for a given skill set can push acceptance rates below 80% even with a strong offer.
Geography changes candidate volume and expectations around process speed.
Employer brand shows up most clearly in view-to-apply rate. Companies with strong reputations in their niche routinely beat published averages at the top of the funnel.
Industry benchmarking research from SHRM’s recruiting studies recommends adjusting benchmark figures for role and market rather than applying one flat number across an entire hiring plan. That guidance matters more than any single percentage. A hiring team that beats the average interview-to-offer rate but has terrible offer acceptance is not doing better than a team with the reverse pattern. Use benchmarks to spot outliers in your own trend line over time, and build role-specific baselines from your last four to six quarters of data before comparing yourself to any external number. Blind benchmarking against a published average, without adjusting for your specific role mix, tends to produce false alarms and missed real problems in about equal measure.
How Do You Diagnose Bottlenecks in Your Hiring Funnel?
Run this four-step process every week, and resist the urge to fix everything at once.
Step one: segment by role and source. Aggregate funnel data across all requisitions and you will average away your real problems. A strong engineering funnel and a weak sales funnel combined will look mediocre and tell you nothing actionable. Break every metric down by role family and, within that, by source.
Step two: compute stage conversions and median time-in-stage together. A low conversion rate at a stage with a short time-in-stage often means the process itself is filtering people. A low conversion rate paired with a long time-in-stage usually means candidates are dropping out from delay and disengagement, not rejection. Those require completely different fixes.
Step three: find the earliest large drop you actually control. This is the diagnostic rule stated at the top of this article, and it holds because fixing a downstream stage rarely helps if an upstream stage is already discarding your best candidates. A guide on reading recruitment funnel metrics from Kira AI frames this the same way: locate where qualified candidates are lost first, then intervene there before anywhere else.
Step four: pick one experiment and assign one owner. Not three experiments. One. Change the job description, adjust screening criteria, or shorten time-to-first-contact, but isolate the variable so you can actually attribute the downstream change to your fix.
Symptom | Likely bottleneck | First fix to try |
|---|---|---|
High applies, low screen rate | Job posting mismatched to actual requirements | Rewrite requisition, tighten must-have criteria |
Low apply rate, high traffic | Application form friction or unclear posting | Shorten form, clarify title and compensation range |
Good screen rate, low interview rate | Screening criteria too strict or inconsistent recruiter judgment | Calibrate screening rubric across recruiters |
Long time-in-stage at interview | Scheduling delays or panel availability | Batch interview days, use scheduling automation |
High interview rate, low offer rate | Hiring manager indecision or panel disagreement | Structured debrief with scoring rubric |
Strong offer rate, weak acceptance | Compensation gap or slow offer process | Benchmark comp, compress offer turnaround |
Pro Tip: Run one experiment per funnel stage at a time, even when you spot two problems simultaneously. Overlapping fixes make it impossible to know which change actually moved the needle, and you will end up repeating both experiments later just to isolate the effect.
Which Sourcing Channels Actually Produce Quality Hires?
Volume metrics tell you how many candidates a channel generates. They tell you almost nothing about whether that channel produces people worth hiring, which is why source effectiveness needs its own set of downstream metrics rather than a simple applicant count.
Track these by channel, not in aggregate:
Source-to-interview rate, which shows whether a channel’s candidates clear your screening bar at a normal rate or need heavy filtering.
Source-to-offer rate, a tighter filter that reveals which channels produce candidates hiring managers actually want.
Source-to-hire rate, the ultimate outcome metric per channel.
Quality of hire by source, tracked through 90-day performance or retention data segmented back to origin.
Cost-per-hire by source, since a channel that costs more per applicant can still win on cost-per-hire if its conversion rate is high enough.
Segment every one of these by role family and seniority before drawing conclusions. A job board might dominate volume for entry-level roles and underperform badly for senior technical positions, where candidates rarely browse open listings and instead respond to direct, personalized outreach or come through referrals.
Here is the pattern worth internalizing: a referral program generating 40 candidates a quarter can outproduce a job board generating 400 applicants, if the referral channel converts at a meaningfully higher rate through screen, interview, and offer, and if referred hires show lower early turnover. The volume gap looks lopsided in a raw applicant report. It disappears, or reverses, the moment you measure source-to-hire and quality of hire side by side. Recruitify’s platform includes contextual matching and AI scoring that can help surface which sources are quietly outperforming on quality, not just volume, once you have enough hires per source to trust the sample.
Time-to-Fill vs. Time-to-Hire: What’s the Real Difference?
Time-to-fill counts from the day a requisition gets approved to the day an offer is accepted. It measures your internal process speed and is the number leadership usually asks about when a seat has been open too long. Time-to-hire counts from a candidate’s first application to acceptance, a shorter and more candidate-centric window that reflects how responsive your process feels from the outside.
Use time-to-fill when diagnosing internal bottlenecks like requisition approval delays or scheduling backlogs. Use time-to-hire when benchmarking candidate experience and comparing your responsiveness against market expectations.
Cost-per-hire is calculated by adding internal recruiter salary allocation (the portion of a recruiter’s time and compensation attributable to that hire), job advertising spend, external agency or contractor fees, and assessment or background check costs, then dividing by the number of hires in the period. Most teams undercount this figure by leaving out recruiter time entirely and only tallying hard costs like job board spend and agency fees.
Threshold Watch: A time-to-fill exceeding 50 days on non-executive roles is a common red flag worth investigating, and an offer acceptance rate below 80% signals a compensation, process, or candidate experience problem that needs attention before it compounds across every open requisition. SHRM’s recruiting benchmarking research recommends treating these thresholds as triggers for investigation rather than hard failure points, since acceptable ranges shift by role and market.
Watch for these red flags in your weekly numbers:
Time-to-fill climbing quarter over quarter for the same role family, even when time-in-stage per individual stage looks stable.
Offer acceptance dropping below your rolling six-month average by more than five points.
Cost-per-hire rising faster than headcount growth, which usually signals over-reliance on paid agency fees rather than internal pipeline health.
Time-to-hire diverging sharply from time-to-fill, which often means requisition approval, not sourcing, is your real delay.
What Should a Recruiting Dashboard Actually Show?
Different stakeholders need different views of the same underlying data, refreshed at different frequencies, and building one dashboard to serve everyone usually satisfies no one.
Weekly recruiter view: pipeline by requisition, stage-by-stage conversion for each open role, active blockers, and a named owner for each blocker. This view exists to answer one question every Monday: what needs attention this week?
TA leader view, refreshed weekly or biweekly: outcome metrics across the team, source mix and source effectiveness, cost trends, and attainment against the hiring plan. This is where pattern recognition across requisitions happens, since a single recruiter’s view won’t reveal a systemic sourcing problem.
C-suite and finance view, refreshed quarterly: total hires, cost trends over time, and attainment summary tied to headcount plan. Finance stakeholders rarely need stage-level detail. They need trend lines and budget accountability.
Only about 21% of talent acquisition teams consider their own analytics genuinely effective, according to a practical guide to talent analytics, and the guide’s core recommendation is a compact dashboard built around four dimensions: pipeline health, source effectiveness, hiring quality, and capacity planning, rather than a sprawling metric list nobody actually reviews.
Pro Tip: Keep your core dashboard to five to seven outcome metrics with drill-down detail available underneath. A dashboard with thirty tracked numbers gets glanced at once and ignored afterward; a focused one gets used every week.
Data hygiene matters as much as dashboard design. Agree on stage definitions before building any report, timestamp every transition automatically rather than relying on manual entry, and audit for duplicate candidate records at least monthly, since duplicates silently inflate top-of-funnel counts and distort every conversion rate downstream.
How Automation Changes Funnel Measurement Without Replacing Judgment
Manual funnel tracking breaks down the moment your requisition count grows past what a single spreadsheet can hold cleanly. Automated CV parsing and OCR extraction eliminate the re-entry errors that come from manually transcribing resumes, and automatic deduplication catches the candidate records that would otherwise double-count in your conversion math. Automated timestamping removes the guesswork from time-in-stage calculations entirely, since every stage transition gets logged the moment it happens rather than reconstructed later from memory.
AI scoring and contextual matching work best as a diagnostic filter rather than a decision-maker: they help you understand why a source underperforms at screen-to-interview conversion by revealing whether the mismatch is skill fit, seniority mismatch, or something in the requisition itself. Recruitify’s AI candidate scoring approach is built around that framing: surface a match score and reasoning, but keep a recruiter in the loop for every advance-or-reject decision.
Automation earns trust only with governance attached. That means maintaining a full audit trail for every scored candidate, running periodic bias checks on scoring outcomes across demographic groups, and preserving explicit human-in-the-loop checkpoints at every stage transition that affects a real candidate’s outcome, not just the ones that are convenient to automate.
Build Your Own Recruitment Funnel KPI Template
A usable template needs six columns: stage, candidates in, candidates advanced, conversion rate, median time-in-stage, and owner. Here is a blank structure you can copy directly into a spreadsheet or your ATS reporting view.
Now walk through a worked example.
Multiply the four conversion rates together: 0.12 × 0.30 × 0.33 × 0.88, which equals roughly 1.04%.
Divide 1 (the single hire you need) by that 1.04% pass-through rate to get your required top-of-funnel applicant count: approximately 96 applicants.
Back-calculate further if you need to plan job board spend or sourcing outreach volume against a target start date.
For senior roles, expect a shorter but steeper funnel: fewer applicants overall, but typically higher conversion at each stage since candidates self-select more carefully before applying. Adjust your target applicant count downward accordingly, but never assume senior-role conversion rates without at least two or three quarters of your own historical data to confirm the pattern. When you’re running multiple sources simultaneously, build a separate pass-through calculation per source rather than blending them, since a job board and a referral program rarely convert at the same rate through the funnel.
Common Measurement Mistakes We Keep Seeing
Three mistakes account for most of the bad funnel data we come across. Inconsistent stage definitions across recruiters or offices make every conversion rate uncomparable, even inside the same company. Vanity metrics, like raw applicant counts celebrated without any reference to downstream conversion, create a false sense of sourcing success while masking a screening or interview problem underneath. And metrics with no assigned owner simply don’t get acted on. A dashboard nobody is accountable for is a report nobody reads.
The single habit that fixes most of this is a weekly pipeline review, ten to fifteen minutes per open requisition, where one person is named as owner for the earliest bottleneck and one experiment gets tested before the next review. Fixing the earliest large, controllable drop first is the highest-leverage move available, a conclusion echoed in Kira AI’s funnel measurement research, and it holds regardless of company size or industry.
We’d rather see a team track five metrics consistently every week than twenty metrics reviewed once a quarter.
- Recruitify Team
Automate the Measurement, Keep the Judgment: Recruitify for Funnel Analytics
Some platforms replace the spreadsheet patchwork most TA teams stitch together to track stage conversions, source performance, and time-in-stage. They automatically timestamp every stage transition, deduplicate candidate records on intake, and surface AI-driven match scores that help explain why a source underperforms, cutting the administrative overhead of manual reporting so your team spends that time running experiments instead of rebuilding pivot tables.
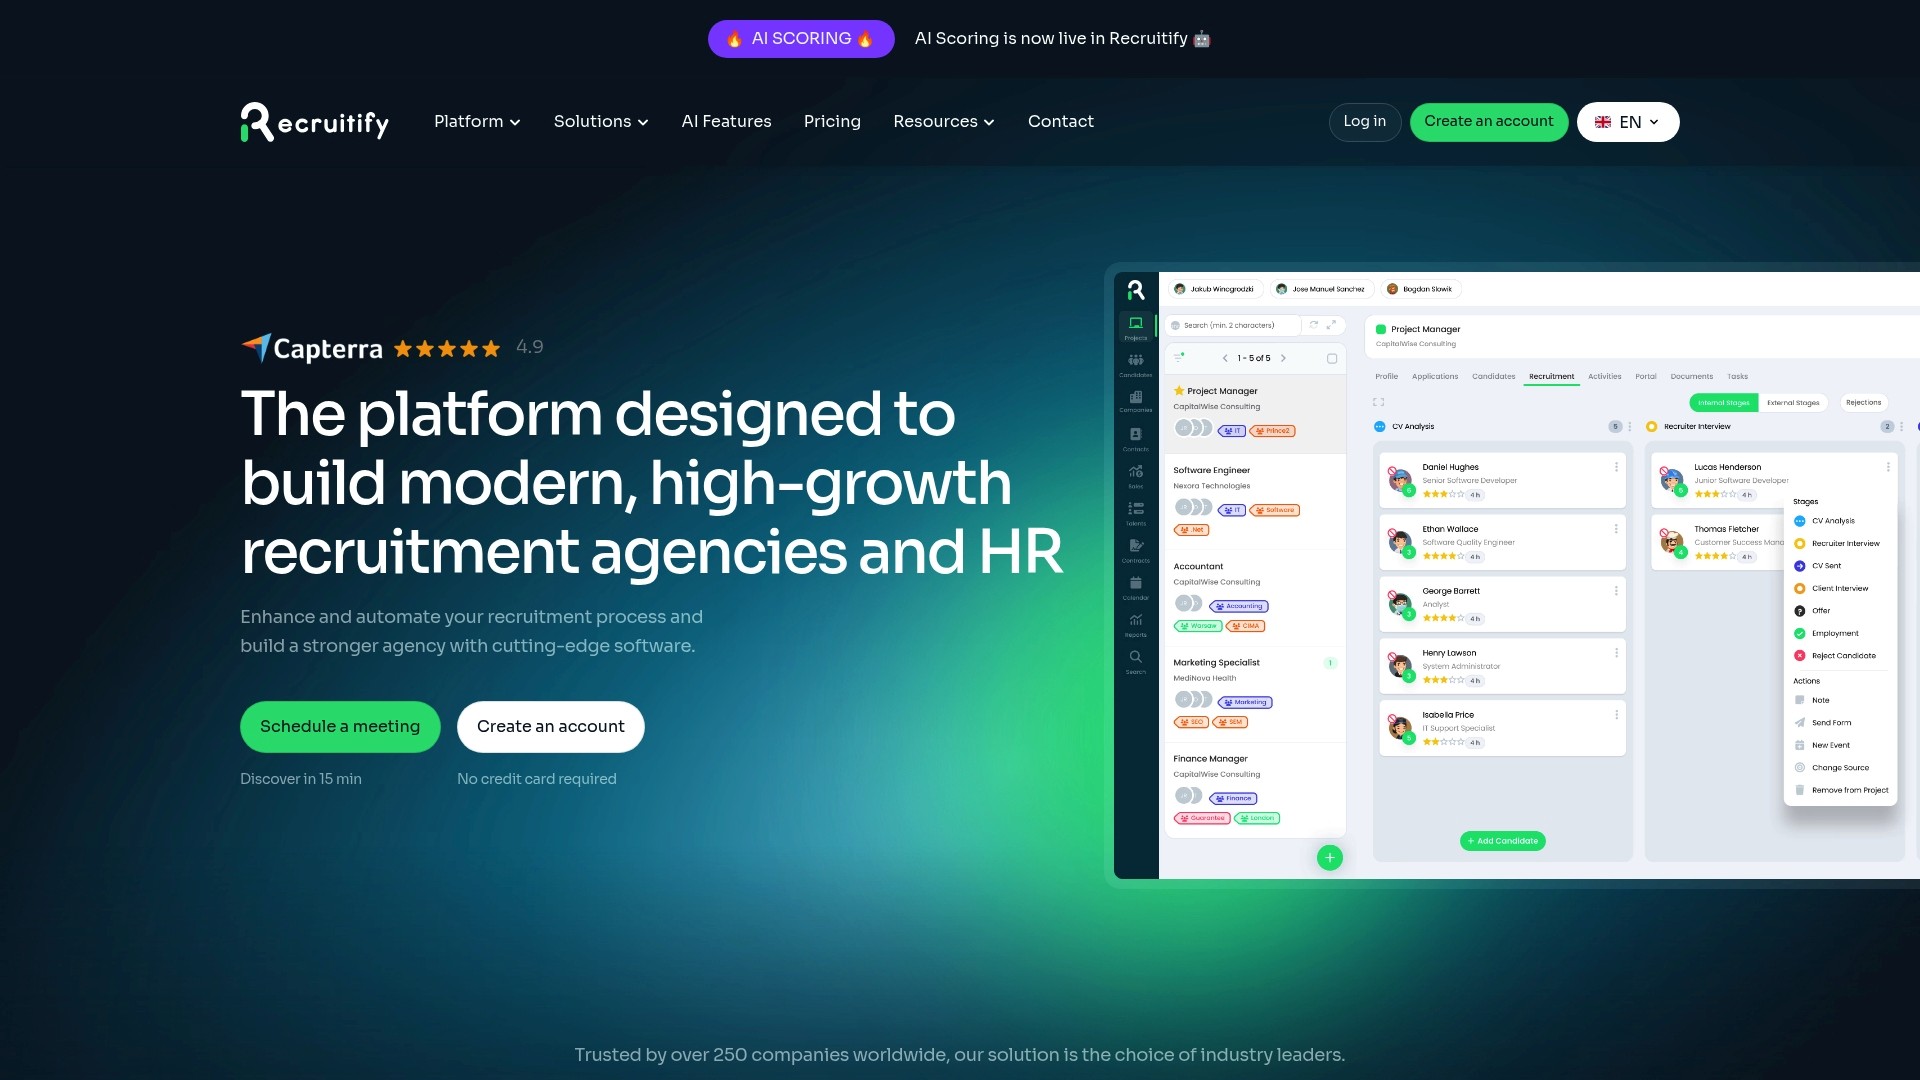
The recruitment project workflow gives you a live view of pipeline health by requisition, the same weekly recruiter dashboard described above, built directly into your daily workflow rather than exported into a separate tool. Pair that with automated CV parsing and workflow automation to eliminate the manual data entry that corrupts time-in-stage calculations in the first place. Every record keeps a full audit trail, so quality-of-hire and source-effectiveness reporting stay defensible when leadership asks how the numbers were built. If your current funnel tracking still lives across three spreadsheets and a recruiter’s memory, book a demo and see what a consolidated pipeline view looks like for your own req load.
Sources
FAQ
What are funnel metrics in recruiting?
Recruitment funnel metrics measure candidate movement through each hiring stage, from application to accepted offer, using conversion rates, time-in-stage, source effectiveness, and cost-per-hire to pinpoint where qualified candidates drop out.
What are the 5 C’s of recruitment?
Definitions of the “5 C’s” vary across sources and are not a single standardized industry framework, so treat any specific list you encounter with caution rather than as an established measurement standard.
What is the 80/20 rule in recruiting?
In recruiting, a small share of sourcing channels or referral sources tend to produce the majority of quality hires, which is why segmenting source effectiveness by outcome, not just volume, matters more than tracking total applicant counts.
What is the 70/30 rule in hiring?
There is no single standardized rule consistently defined across recruiting sources; some use informal splits between active and passive candidate sourcing effort, but these are not benchmarks backed by consistent industry data.
How do you calculate stage conversion rate?
Divide the number of candidates advancing to the next stage by the number entering that stage, then multiply by 100. Multiplying every stage’s conversion rate together gives you the overall pass-through rate needed to size your top-of-funnel targets.
Recommended


News & Updates
Stay up-to-date with the latest innovations, features, and tips about Recruitify!
By providing your email address within the newsletter sign-up form, you confirm its processing to send marketing information regarding the Administrator’s products and services. The Administrator of your personal data processed for the abovementioned purposes is Recruitify Spółka z o.o., based in Warsaw, Poland (KRS 0000709889). For more information on the principles of personal data processing and the rights of data subjects, please check the Privacy Policy.

Last updated:
Track 5 Recruitment Funnel Metrics That Predict Hires for TA Teams
Recruitment Process
The Recruitify Team
Track five numbers every week: stage conversion rate, time-in-stage, source effectiveness, cost-per-hire, and offer acceptance. Layer quality of hire on top to confirm the funnel is producing the right outcomes, not just fast ones. Then apply one rule before anything else: find the earliest stage in your funnel where a large, controllable drop occurs, and fix that first. Benchmarks, a reusable template, and where automation genuinely helps all follow from that diagnostic habit based on your own data.
TL;DR:
Identifying and fixing the earliest stage with a large, controllable drop in the funnel provides the highest leverage for improving overall recruitment efficiency.
Benchmark data varies widely, but internal analysis over multiple quarters offers more accurate, role-specific baselines than relying solely on external averages.
Segmenting funnel metrics by role and source reveals bottlenecks, such as scheduling delays at interview stages or applicant mismatch at application, which require targeted fixes.
Automation of data collection, timestamping, and candidate deduplication improves accuracy in time-in-stage and source effectiveness metrics, while AI scoring supports diagnostic insights.
A focused dashboard with five to seven outcome metrics, refreshed weekly, enhances accountability and enables continuous improvement of recruitment processes.
RecruitifyTurn Funnel Data Into PlacementsRecruitify brings recruitment and sales workflows together, helping IT agencies reduce administrative work and identify stronger candidate matches.Explore Recruitify
Table of Contents
Recruitment Funnel Metrics: Core Definitions and Formulas
What Are Realistic Recruitment Funnel Benchmarks By Stage?
How Do You Diagnose Bottlenecks in Your Hiring Funnel?
Which Sourcing Channels Actually Produce Quality Hires?
Time-to-Fill vs. Time-to-Hire: What’s the Real Difference?
What Should a Recruiting Dashboard Actually Show?
How Automation Changes Funnel Measurement Without Replacing Judgment
Build Your Own Recruitment Funnel KPI Template
Common Measurement Mistakes We Keep Seeing
Automate the Measurement, Keep the Judgment: Recruitify for Funnel Analytics
Sources
FAQ
Recruitment Funnel Metrics: Core Definitions and Formulas
Recruitment funnel metrics measure how candidates move through your hiring process, from first click to accepted offer, and where they stop moving. The formulas are simple, but consistency in how you define each stage is what makes the numbers trustworthy across roles, teams, and quarters.
The foundational formula is the stage conversion rate: (candidates advancing ÷ candidates entering) × 100. Say 500 people view a job posting, 60 apply, 18 get screened, 6 reach an interview, and 2 receive an offer that gets accepted. Multiply those rates together and you get the overall pass-through rate, which tells you how many top-of-funnel candidates you need to produce one hire, a calculation covered in more detail in the stage conversion breakdown from HRHelperG.
Beyond the headline conversion number, a handful of sub-metrics deserve their own line in your tracker:
Application completion rate measures how many people who start an application actually submit it, a proxy for how much friction your careers page adds.
Screen-to-interview rate isolates recruiter judgment from sourcing quality, since it starts after the initial pool has already been filtered.
Interview-to-offer rate reflects hiring manager decisiveness and interview panel alignment.
Offer-to-accept rate captures competitiveness of compensation, timing, and candidate experience during negotiation.
Accept-to-start rate catches counteroffers, ghosting, and candidates who accept but never show up.
Time metrics run in parallel to conversion metrics and answer a different question: not “how many,” but “how long.” Time-in-stage is the median number of days a candidate sits in one specific stage before moving or dropping out. Time-to-fill counts days from requisition approval to accepted offer. Time-to-hire counts days from a candidate’s first application to their acceptance, a narrower window that reflects candidate experience more than internal process speed, a distinction Dayforce’s recruitment analytics research treats as essential rather than optional.
Quality metrics close the loop: quality of hire (often a 90-day performance or retention score), early turnover (departures inside the first six months), and hiring manager satisfaction (typically a post-hire survey score). Pull your raw numbers from ATS timestamps and job board analytics, but agree on stage definitions in writing first. A “screen” that means a recruiter call at one office and a hiring manager review at another will corrupt every downstream comparison.
What Are Realistic Recruitment Funnel Benchmarks By Stage?
Benchmark figures vary widely by source, role, and market, so treat every number below as a starting reference point, not a target to hit blindly.
Reported Stage Benchmarks: Click-to-apply conversion averages around 6%, application-to-interview around 3%, and interview-to-hire around 27%, according to recruitment funnel benchmark data. Offer acceptance typically lands between 85% and 92%. A separate set of published figures from Jobvite’s recruiting funnel benchmarks puts visitor-to-applicant conversion near 34.6%, application-to-interview near 8.4%, interview-to-offer near 36.2%, and offer-to-hire near 55.6%, with average time-to-hire around 43 days.
Notice how wide the spread is between those two benchmark sets, even for comparable stages. That gap is the point. Neither source is wrong. They are counting different funnel entry points and different candidate pools.
Several contextual factors move these numbers more than the benchmark source does:
Seniority compresses the funnel at senior levels, where fewer, more qualified candidates apply but conversion per stage tends to run higher.
Role function matters because technical and specialized roles often see lower apply rates but higher screen-to-interview conversion, since applicants tend to self-select more carefully.
Market tightness shifts offer acceptance directly. A candidate-scarce market for a given skill set can push acceptance rates below 80% even with a strong offer.
Geography changes candidate volume and expectations around process speed.
Employer brand shows up most clearly in view-to-apply rate. Companies with strong reputations in their niche routinely beat published averages at the top of the funnel.
Industry benchmarking research from SHRM’s recruiting studies recommends adjusting benchmark figures for role and market rather than applying one flat number across an entire hiring plan. That guidance matters more than any single percentage. A hiring team that beats the average interview-to-offer rate but has terrible offer acceptance is not doing better than a team with the reverse pattern. Use benchmarks to spot outliers in your own trend line over time, and build role-specific baselines from your last four to six quarters of data before comparing yourself to any external number. Blind benchmarking against a published average, without adjusting for your specific role mix, tends to produce false alarms and missed real problems in about equal measure.
How Do You Diagnose Bottlenecks in Your Hiring Funnel?
Run this four-step process every week, and resist the urge to fix everything at once.
Step one: segment by role and source. Aggregate funnel data across all requisitions and you will average away your real problems. A strong engineering funnel and a weak sales funnel combined will look mediocre and tell you nothing actionable. Break every metric down by role family and, within that, by source.
Step two: compute stage conversions and median time-in-stage together. A low conversion rate at a stage with a short time-in-stage often means the process itself is filtering people. A low conversion rate paired with a long time-in-stage usually means candidates are dropping out from delay and disengagement, not rejection. Those require completely different fixes.
Step three: find the earliest large drop you actually control. This is the diagnostic rule stated at the top of this article, and it holds because fixing a downstream stage rarely helps if an upstream stage is already discarding your best candidates. A guide on reading recruitment funnel metrics from Kira AI frames this the same way: locate where qualified candidates are lost first, then intervene there before anywhere else.
Step four: pick one experiment and assign one owner. Not three experiments. One. Change the job description, adjust screening criteria, or shorten time-to-first-contact, but isolate the variable so you can actually attribute the downstream change to your fix.
Symptom | Likely bottleneck | First fix to try |
|---|---|---|
High applies, low screen rate | Job posting mismatched to actual requirements | Rewrite requisition, tighten must-have criteria |
Low apply rate, high traffic | Application form friction or unclear posting | Shorten form, clarify title and compensation range |
Good screen rate, low interview rate | Screening criteria too strict or inconsistent recruiter judgment | Calibrate screening rubric across recruiters |
Long time-in-stage at interview | Scheduling delays or panel availability | Batch interview days, use scheduling automation |
High interview rate, low offer rate | Hiring manager indecision or panel disagreement | Structured debrief with scoring rubric |
Strong offer rate, weak acceptance | Compensation gap or slow offer process | Benchmark comp, compress offer turnaround |
Pro Tip: Run one experiment per funnel stage at a time, even when you spot two problems simultaneously. Overlapping fixes make it impossible to know which change actually moved the needle, and you will end up repeating both experiments later just to isolate the effect.
Which Sourcing Channels Actually Produce Quality Hires?
Volume metrics tell you how many candidates a channel generates. They tell you almost nothing about whether that channel produces people worth hiring, which is why source effectiveness needs its own set of downstream metrics rather than a simple applicant count.
Track these by channel, not in aggregate:
Source-to-interview rate, which shows whether a channel’s candidates clear your screening bar at a normal rate or need heavy filtering.
Source-to-offer rate, a tighter filter that reveals which channels produce candidates hiring managers actually want.
Source-to-hire rate, the ultimate outcome metric per channel.
Quality of hire by source, tracked through 90-day performance or retention data segmented back to origin.
Cost-per-hire by source, since a channel that costs more per applicant can still win on cost-per-hire if its conversion rate is high enough.
Segment every one of these by role family and seniority before drawing conclusions. A job board might dominate volume for entry-level roles and underperform badly for senior technical positions, where candidates rarely browse open listings and instead respond to direct, personalized outreach or come through referrals.
Here is the pattern worth internalizing: a referral program generating 40 candidates a quarter can outproduce a job board generating 400 applicants, if the referral channel converts at a meaningfully higher rate through screen, interview, and offer, and if referred hires show lower early turnover. The volume gap looks lopsided in a raw applicant report. It disappears, or reverses, the moment you measure source-to-hire and quality of hire side by side. Recruitify’s platform includes contextual matching and AI scoring that can help surface which sources are quietly outperforming on quality, not just volume, once you have enough hires per source to trust the sample.
Time-to-Fill vs. Time-to-Hire: What’s the Real Difference?
Time-to-fill counts from the day a requisition gets approved to the day an offer is accepted. It measures your internal process speed and is the number leadership usually asks about when a seat has been open too long. Time-to-hire counts from a candidate’s first application to acceptance, a shorter and more candidate-centric window that reflects how responsive your process feels from the outside.
Use time-to-fill when diagnosing internal bottlenecks like requisition approval delays or scheduling backlogs. Use time-to-hire when benchmarking candidate experience and comparing your responsiveness against market expectations.
Cost-per-hire is calculated by adding internal recruiter salary allocation (the portion of a recruiter’s time and compensation attributable to that hire), job advertising spend, external agency or contractor fees, and assessment or background check costs, then dividing by the number of hires in the period. Most teams undercount this figure by leaving out recruiter time entirely and only tallying hard costs like job board spend and agency fees.
Threshold Watch: A time-to-fill exceeding 50 days on non-executive roles is a common red flag worth investigating, and an offer acceptance rate below 80% signals a compensation, process, or candidate experience problem that needs attention before it compounds across every open requisition. SHRM’s recruiting benchmarking research recommends treating these thresholds as triggers for investigation rather than hard failure points, since acceptable ranges shift by role and market.
Watch for these red flags in your weekly numbers:
Time-to-fill climbing quarter over quarter for the same role family, even when time-in-stage per individual stage looks stable.
Offer acceptance dropping below your rolling six-month average by more than five points.
Cost-per-hire rising faster than headcount growth, which usually signals over-reliance on paid agency fees rather than internal pipeline health.
Time-to-hire diverging sharply from time-to-fill, which often means requisition approval, not sourcing, is your real delay.
What Should a Recruiting Dashboard Actually Show?
Different stakeholders need different views of the same underlying data, refreshed at different frequencies, and building one dashboard to serve everyone usually satisfies no one.
Weekly recruiter view: pipeline by requisition, stage-by-stage conversion for each open role, active blockers, and a named owner for each blocker. This view exists to answer one question every Monday: what needs attention this week?
TA leader view, refreshed weekly or biweekly: outcome metrics across the team, source mix and source effectiveness, cost trends, and attainment against the hiring plan. This is where pattern recognition across requisitions happens, since a single recruiter’s view won’t reveal a systemic sourcing problem.
C-suite and finance view, refreshed quarterly: total hires, cost trends over time, and attainment summary tied to headcount plan. Finance stakeholders rarely need stage-level detail. They need trend lines and budget accountability.
Only about 21% of talent acquisition teams consider their own analytics genuinely effective, according to a practical guide to talent analytics, and the guide’s core recommendation is a compact dashboard built around four dimensions: pipeline health, source effectiveness, hiring quality, and capacity planning, rather than a sprawling metric list nobody actually reviews.
Pro Tip: Keep your core dashboard to five to seven outcome metrics with drill-down detail available underneath. A dashboard with thirty tracked numbers gets glanced at once and ignored afterward; a focused one gets used every week.
Data hygiene matters as much as dashboard design. Agree on stage definitions before building any report, timestamp every transition automatically rather than relying on manual entry, and audit for duplicate candidate records at least monthly, since duplicates silently inflate top-of-funnel counts and distort every conversion rate downstream.
How Automation Changes Funnel Measurement Without Replacing Judgment
Manual funnel tracking breaks down the moment your requisition count grows past what a single spreadsheet can hold cleanly. Automated CV parsing and OCR extraction eliminate the re-entry errors that come from manually transcribing resumes, and automatic deduplication catches the candidate records that would otherwise double-count in your conversion math. Automated timestamping removes the guesswork from time-in-stage calculations entirely, since every stage transition gets logged the moment it happens rather than reconstructed later from memory.
AI scoring and contextual matching work best as a diagnostic filter rather than a decision-maker: they help you understand why a source underperforms at screen-to-interview conversion by revealing whether the mismatch is skill fit, seniority mismatch, or something in the requisition itself. Recruitify’s AI candidate scoring approach is built around that framing: surface a match score and reasoning, but keep a recruiter in the loop for every advance-or-reject decision.
Automation earns trust only with governance attached. That means maintaining a full audit trail for every scored candidate, running periodic bias checks on scoring outcomes across demographic groups, and preserving explicit human-in-the-loop checkpoints at every stage transition that affects a real candidate’s outcome, not just the ones that are convenient to automate.
Build Your Own Recruitment Funnel KPI Template
A usable template needs six columns: stage, candidates in, candidates advanced, conversion rate, median time-in-stage, and owner. Here is a blank structure you can copy directly into a spreadsheet or your ATS reporting view.
Now walk through a worked example.
Multiply the four conversion rates together: 0.12 × 0.30 × 0.33 × 0.88, which equals roughly 1.04%.
Divide 1 (the single hire you need) by that 1.04% pass-through rate to get your required top-of-funnel applicant count: approximately 96 applicants.
Back-calculate further if you need to plan job board spend or sourcing outreach volume against a target start date.
For senior roles, expect a shorter but steeper funnel: fewer applicants overall, but typically higher conversion at each stage since candidates self-select more carefully before applying. Adjust your target applicant count downward accordingly, but never assume senior-role conversion rates without at least two or three quarters of your own historical data to confirm the pattern. When you’re running multiple sources simultaneously, build a separate pass-through calculation per source rather than blending them, since a job board and a referral program rarely convert at the same rate through the funnel.
Common Measurement Mistakes We Keep Seeing
Three mistakes account for most of the bad funnel data we come across. Inconsistent stage definitions across recruiters or offices make every conversion rate uncomparable, even inside the same company. Vanity metrics, like raw applicant counts celebrated without any reference to downstream conversion, create a false sense of sourcing success while masking a screening or interview problem underneath. And metrics with no assigned owner simply don’t get acted on. A dashboard nobody is accountable for is a report nobody reads.
The single habit that fixes most of this is a weekly pipeline review, ten to fifteen minutes per open requisition, where one person is named as owner for the earliest bottleneck and one experiment gets tested before the next review. Fixing the earliest large, controllable drop first is the highest-leverage move available, a conclusion echoed in Kira AI’s funnel measurement research, and it holds regardless of company size or industry.
We’d rather see a team track five metrics consistently every week than twenty metrics reviewed once a quarter.
- Recruitify Team
Automate the Measurement, Keep the Judgment: Recruitify for Funnel Analytics
Some platforms replace the spreadsheet patchwork most TA teams stitch together to track stage conversions, source performance, and time-in-stage. They automatically timestamp every stage transition, deduplicate candidate records on intake, and surface AI-driven match scores that help explain why a source underperforms, cutting the administrative overhead of manual reporting so your team spends that time running experiments instead of rebuilding pivot tables.
The recruitment project workflow gives you a live view of pipeline health by requisition, the same weekly recruiter dashboard described above, built directly into your daily workflow rather than exported into a separate tool. Pair that with automated CV parsing and workflow automation to eliminate the manual data entry that corrupts time-in-stage calculations in the first place. Every record keeps a full audit trail, so quality-of-hire and source-effectiveness reporting stay defensible when leadership asks how the numbers were built. If your current funnel tracking still lives across three spreadsheets and a recruiter’s memory, book a demo and see what a consolidated pipeline view looks like for your own req load.
Sources
FAQ
What are funnel metrics in recruiting?
Recruitment funnel metrics measure candidate movement through each hiring stage, from application to accepted offer, using conversion rates, time-in-stage, source effectiveness, and cost-per-hire to pinpoint where qualified candidates drop out.
What are the 5 C’s of recruitment?
Definitions of the “5 C’s” vary across sources and are not a single standardized industry framework, so treat any specific list you encounter with caution rather than as an established measurement standard.
What is the 80/20 rule in recruiting?
In recruiting, a small share of sourcing channels or referral sources tend to produce the majority of quality hires, which is why segmenting source effectiveness by outcome, not just volume, matters more than tracking total applicant counts.
What is the 70/30 rule in hiring?
There is no single standardized rule consistently defined across recruiting sources; some use informal splits between active and passive candidate sourcing effort, but these are not benchmarks backed by consistent industry data.
How do you calculate stage conversion rate?
Divide the number of candidates advancing to the next stage by the number entering that stage, then multiply by 100. Multiplying every stage’s conversion rate together gives you the overall pass-through rate needed to size your top-of-funnel targets.
Recommended
News & Updates
Stay up-to-date with the latest innovations, features, and tips about Recruitify!
By providing your email address within the newsletter sign-up form, you confirm its processing to send marketing information regarding the Administrator’s products and services. The Administrator of your personal data processed for the abovementioned purposes is Recruitify Spółka z o.o., based in Warsaw, Poland (KRS 0000709889). For more information on the principles of personal data processing and the rights of data subjects, please check the Privacy Policy.
Last updated:
Track 5 Recruitment Funnel Metrics That Predict Hires for TA Teams
Recruitment Process
The Recruitify Team
Track five numbers every week: stage conversion rate, time-in-stage, source effectiveness, cost-per-hire, and offer acceptance. Layer quality of hire on top to confirm the funnel is producing the right outcomes, not just fast ones. Then apply one rule before anything else: find the earliest stage in your funnel where a large, controllable drop occurs, and fix that first. Benchmarks, a reusable template, and where automation genuinely helps all follow from that diagnostic habit based on your own data.
TL;DR:
Identifying and fixing the earliest stage with a large, controllable drop in the funnel provides the highest leverage for improving overall recruitment efficiency.
Benchmark data varies widely, but internal analysis over multiple quarters offers more accurate, role-specific baselines than relying solely on external averages.
Segmenting funnel metrics by role and source reveals bottlenecks, such as scheduling delays at interview stages or applicant mismatch at application, which require targeted fixes.
Automation of data collection, timestamping, and candidate deduplication improves accuracy in time-in-stage and source effectiveness metrics, while AI scoring supports diagnostic insights.
A focused dashboard with five to seven outcome metrics, refreshed weekly, enhances accountability and enables continuous improvement of recruitment processes.
RecruitifyTurn Funnel Data Into PlacementsRecruitify brings recruitment and sales workflows together, helping IT agencies reduce administrative work and identify stronger candidate matches.Explore Recruitify
Table of Contents
Recruitment Funnel Metrics: Core Definitions and Formulas
What Are Realistic Recruitment Funnel Benchmarks By Stage?
How Do You Diagnose Bottlenecks in Your Hiring Funnel?
Which Sourcing Channels Actually Produce Quality Hires?
Time-to-Fill vs. Time-to-Hire: What’s the Real Difference?
What Should a Recruiting Dashboard Actually Show?
How Automation Changes Funnel Measurement Without Replacing Judgment
Build Your Own Recruitment Funnel KPI Template
Common Measurement Mistakes We Keep Seeing
Automate the Measurement, Keep the Judgment: Recruitify for Funnel Analytics
Sources
FAQ
Recruitment Funnel Metrics: Core Definitions and Formulas
Recruitment funnel metrics measure how candidates move through your hiring process, from first click to accepted offer, and where they stop moving. The formulas are simple, but consistency in how you define each stage is what makes the numbers trustworthy across roles, teams, and quarters.
The foundational formula is the stage conversion rate: (candidates advancing ÷ candidates entering) × 100. Say 500 people view a job posting, 60 apply, 18 get screened, 6 reach an interview, and 2 receive an offer that gets accepted. Multiply those rates together and you get the overall pass-through rate, which tells you how many top-of-funnel candidates you need to produce one hire, a calculation covered in more detail in the stage conversion breakdown from HRHelperG.
Beyond the headline conversion number, a handful of sub-metrics deserve their own line in your tracker:
Application completion rate measures how many people who start an application actually submit it, a proxy for how much friction your careers page adds.
Screen-to-interview rate isolates recruiter judgment from sourcing quality, since it starts after the initial pool has already been filtered.
Interview-to-offer rate reflects hiring manager decisiveness and interview panel alignment.
Offer-to-accept rate captures competitiveness of compensation, timing, and candidate experience during negotiation.
Accept-to-start rate catches counteroffers, ghosting, and candidates who accept but never show up.
Time metrics run in parallel to conversion metrics and answer a different question: not “how many,” but “how long.” Time-in-stage is the median number of days a candidate sits in one specific stage before moving or dropping out. Time-to-fill counts days from requisition approval to accepted offer. Time-to-hire counts days from a candidate’s first application to their acceptance, a narrower window that reflects candidate experience more than internal process speed, a distinction Dayforce’s recruitment analytics research treats as essential rather than optional.
Quality metrics close the loop: quality of hire (often a 90-day performance or retention score), early turnover (departures inside the first six months), and hiring manager satisfaction (typically a post-hire survey score). Pull your raw numbers from ATS timestamps and job board analytics, but agree on stage definitions in writing first. A “screen” that means a recruiter call at one office and a hiring manager review at another will corrupt every downstream comparison.
What Are Realistic Recruitment Funnel Benchmarks By Stage?
Benchmark figures vary widely by source, role, and market, so treat every number below as a starting reference point, not a target to hit blindly.
Reported Stage Benchmarks: Click-to-apply conversion averages around 6%, application-to-interview around 3%, and interview-to-hire around 27%, according to recruitment funnel benchmark data. Offer acceptance typically lands between 85% and 92%. A separate set of published figures from Jobvite’s recruiting funnel benchmarks puts visitor-to-applicant conversion near 34.6%, application-to-interview near 8.4%, interview-to-offer near 36.2%, and offer-to-hire near 55.6%, with average time-to-hire around 43 days.
Notice how wide the spread is between those two benchmark sets, even for comparable stages. That gap is the point. Neither source is wrong. They are counting different funnel entry points and different candidate pools.
Several contextual factors move these numbers more than the benchmark source does:
Seniority compresses the funnel at senior levels, where fewer, more qualified candidates apply but conversion per stage tends to run higher.
Role function matters because technical and specialized roles often see lower apply rates but higher screen-to-interview conversion, since applicants tend to self-select more carefully.
Market tightness shifts offer acceptance directly. A candidate-scarce market for a given skill set can push acceptance rates below 80% even with a strong offer.
Geography changes candidate volume and expectations around process speed.
Employer brand shows up most clearly in view-to-apply rate. Companies with strong reputations in their niche routinely beat published averages at the top of the funnel.
Industry benchmarking research from SHRM’s recruiting studies recommends adjusting benchmark figures for role and market rather than applying one flat number across an entire hiring plan. That guidance matters more than any single percentage. A hiring team that beats the average interview-to-offer rate but has terrible offer acceptance is not doing better than a team with the reverse pattern. Use benchmarks to spot outliers in your own trend line over time, and build role-specific baselines from your last four to six quarters of data before comparing yourself to any external number. Blind benchmarking against a published average, without adjusting for your specific role mix, tends to produce false alarms and missed real problems in about equal measure.
How Do You Diagnose Bottlenecks in Your Hiring Funnel?
Run this four-step process every week, and resist the urge to fix everything at once.
Step one: segment by role and source. Aggregate funnel data across all requisitions and you will average away your real problems. A strong engineering funnel and a weak sales funnel combined will look mediocre and tell you nothing actionable. Break every metric down by role family and, within that, by source.
Step two: compute stage conversions and median time-in-stage together. A low conversion rate at a stage with a short time-in-stage often means the process itself is filtering people. A low conversion rate paired with a long time-in-stage usually means candidates are dropping out from delay and disengagement, not rejection. Those require completely different fixes.
Step three: find the earliest large drop you actually control. This is the diagnostic rule stated at the top of this article, and it holds because fixing a downstream stage rarely helps if an upstream stage is already discarding your best candidates. A guide on reading recruitment funnel metrics from Kira AI frames this the same way: locate where qualified candidates are lost first, then intervene there before anywhere else.
Step four: pick one experiment and assign one owner. Not three experiments. One. Change the job description, adjust screening criteria, or shorten time-to-first-contact, but isolate the variable so you can actually attribute the downstream change to your fix.
Symptom | Likely bottleneck | First fix to try |
|---|---|---|
High applies, low screen rate | Job posting mismatched to actual requirements | Rewrite requisition, tighten must-have criteria |
Low apply rate, high traffic | Application form friction or unclear posting | Shorten form, clarify title and compensation range |
Good screen rate, low interview rate | Screening criteria too strict or inconsistent recruiter judgment | Calibrate screening rubric across recruiters |
Long time-in-stage at interview | Scheduling delays or panel availability | Batch interview days, use scheduling automation |
High interview rate, low offer rate | Hiring manager indecision or panel disagreement | Structured debrief with scoring rubric |
Strong offer rate, weak acceptance | Compensation gap or slow offer process | Benchmark comp, compress offer turnaround |
Pro Tip: Run one experiment per funnel stage at a time, even when you spot two problems simultaneously. Overlapping fixes make it impossible to know which change actually moved the needle, and you will end up repeating both experiments later just to isolate the effect.
Which Sourcing Channels Actually Produce Quality Hires?
Volume metrics tell you how many candidates a channel generates. They tell you almost nothing about whether that channel produces people worth hiring, which is why source effectiveness needs its own set of downstream metrics rather than a simple applicant count.
Track these by channel, not in aggregate:
Source-to-interview rate, which shows whether a channel’s candidates clear your screening bar at a normal rate or need heavy filtering.
Source-to-offer rate, a tighter filter that reveals which channels produce candidates hiring managers actually want.
Source-to-hire rate, the ultimate outcome metric per channel.
Quality of hire by source, tracked through 90-day performance or retention data segmented back to origin.
Cost-per-hire by source, since a channel that costs more per applicant can still win on cost-per-hire if its conversion rate is high enough.
Segment every one of these by role family and seniority before drawing conclusions. A job board might dominate volume for entry-level roles and underperform badly for senior technical positions, where candidates rarely browse open listings and instead respond to direct, personalized outreach or come through referrals.
Here is the pattern worth internalizing: a referral program generating 40 candidates a quarter can outproduce a job board generating 400 applicants, if the referral channel converts at a meaningfully higher rate through screen, interview, and offer, and if referred hires show lower early turnover. The volume gap looks lopsided in a raw applicant report. It disappears, or reverses, the moment you measure source-to-hire and quality of hire side by side. Recruitify’s platform includes contextual matching and AI scoring that can help surface which sources are quietly outperforming on quality, not just volume, once you have enough hires per source to trust the sample.
Time-to-Fill vs. Time-to-Hire: What’s the Real Difference?
Time-to-fill counts from the day a requisition gets approved to the day an offer is accepted. It measures your internal process speed and is the number leadership usually asks about when a seat has been open too long. Time-to-hire counts from a candidate’s first application to acceptance, a shorter and more candidate-centric window that reflects how responsive your process feels from the outside.
Use time-to-fill when diagnosing internal bottlenecks like requisition approval delays or scheduling backlogs. Use time-to-hire when benchmarking candidate experience and comparing your responsiveness against market expectations.
Cost-per-hire is calculated by adding internal recruiter salary allocation (the portion of a recruiter’s time and compensation attributable to that hire), job advertising spend, external agency or contractor fees, and assessment or background check costs, then dividing by the number of hires in the period. Most teams undercount this figure by leaving out recruiter time entirely and only tallying hard costs like job board spend and agency fees.
Threshold Watch: A time-to-fill exceeding 50 days on non-executive roles is a common red flag worth investigating, and an offer acceptance rate below 80% signals a compensation, process, or candidate experience problem that needs attention before it compounds across every open requisition. SHRM’s recruiting benchmarking research recommends treating these thresholds as triggers for investigation rather than hard failure points, since acceptable ranges shift by role and market.
Watch for these red flags in your weekly numbers:
Time-to-fill climbing quarter over quarter for the same role family, even when time-in-stage per individual stage looks stable.
Offer acceptance dropping below your rolling six-month average by more than five points.
Cost-per-hire rising faster than headcount growth, which usually signals over-reliance on paid agency fees rather than internal pipeline health.
Time-to-hire diverging sharply from time-to-fill, which often means requisition approval, not sourcing, is your real delay.
What Should a Recruiting Dashboard Actually Show?
Different stakeholders need different views of the same underlying data, refreshed at different frequencies, and building one dashboard to serve everyone usually satisfies no one.
Weekly recruiter view: pipeline by requisition, stage-by-stage conversion for each open role, active blockers, and a named owner for each blocker. This view exists to answer one question every Monday: what needs attention this week?
TA leader view, refreshed weekly or biweekly: outcome metrics across the team, source mix and source effectiveness, cost trends, and attainment against the hiring plan. This is where pattern recognition across requisitions happens, since a single recruiter’s view won’t reveal a systemic sourcing problem.
C-suite and finance view, refreshed quarterly: total hires, cost trends over time, and attainment summary tied to headcount plan. Finance stakeholders rarely need stage-level detail. They need trend lines and budget accountability.
Only about 21% of talent acquisition teams consider their own analytics genuinely effective, according to a practical guide to talent analytics, and the guide’s core recommendation is a compact dashboard built around four dimensions: pipeline health, source effectiveness, hiring quality, and capacity planning, rather than a sprawling metric list nobody actually reviews.
Pro Tip: Keep your core dashboard to five to seven outcome metrics with drill-down detail available underneath. A dashboard with thirty tracked numbers gets glanced at once and ignored afterward; a focused one gets used every week.
Data hygiene matters as much as dashboard design. Agree on stage definitions before building any report, timestamp every transition automatically rather than relying on manual entry, and audit for duplicate candidate records at least monthly, since duplicates silently inflate top-of-funnel counts and distort every conversion rate downstream.
How Automation Changes Funnel Measurement Without Replacing Judgment
Manual funnel tracking breaks down the moment your requisition count grows past what a single spreadsheet can hold cleanly. Automated CV parsing and OCR extraction eliminate the re-entry errors that come from manually transcribing resumes, and automatic deduplication catches the candidate records that would otherwise double-count in your conversion math. Automated timestamping removes the guesswork from time-in-stage calculations entirely, since every stage transition gets logged the moment it happens rather than reconstructed later from memory.
AI scoring and contextual matching work best as a diagnostic filter rather than a decision-maker: they help you understand why a source underperforms at screen-to-interview conversion by revealing whether the mismatch is skill fit, seniority mismatch, or something in the requisition itself. Recruitify’s AI candidate scoring approach is built around that framing: surface a match score and reasoning, but keep a recruiter in the loop for every advance-or-reject decision.
Automation earns trust only with governance attached. That means maintaining a full audit trail for every scored candidate, running periodic bias checks on scoring outcomes across demographic groups, and preserving explicit human-in-the-loop checkpoints at every stage transition that affects a real candidate’s outcome, not just the ones that are convenient to automate.
Build Your Own Recruitment Funnel KPI Template
A usable template needs six columns: stage, candidates in, candidates advanced, conversion rate, median time-in-stage, and owner. Here is a blank structure you can copy directly into a spreadsheet or your ATS reporting view.
Now walk through a worked example.
Multiply the four conversion rates together: 0.12 × 0.30 × 0.33 × 0.88, which equals roughly 1.04%.
Divide 1 (the single hire you need) by that 1.04% pass-through rate to get your required top-of-funnel applicant count: approximately 96 applicants.
Back-calculate further if you need to plan job board spend or sourcing outreach volume against a target start date.
For senior roles, expect a shorter but steeper funnel: fewer applicants overall, but typically higher conversion at each stage since candidates self-select more carefully before applying. Adjust your target applicant count downward accordingly, but never assume senior-role conversion rates without at least two or three quarters of your own historical data to confirm the pattern. When you’re running multiple sources simultaneously, build a separate pass-through calculation per source rather than blending them, since a job board and a referral program rarely convert at the same rate through the funnel.
Common Measurement Mistakes We Keep Seeing
Three mistakes account for most of the bad funnel data we come across. Inconsistent stage definitions across recruiters or offices make every conversion rate uncomparable, even inside the same company. Vanity metrics, like raw applicant counts celebrated without any reference to downstream conversion, create a false sense of sourcing success while masking a screening or interview problem underneath. And metrics with no assigned owner simply don’t get acted on. A dashboard nobody is accountable for is a report nobody reads.
The single habit that fixes most of this is a weekly pipeline review, ten to fifteen minutes per open requisition, where one person is named as owner for the earliest bottleneck and one experiment gets tested before the next review. Fixing the earliest large, controllable drop first is the highest-leverage move available, a conclusion echoed in Kira AI’s funnel measurement research, and it holds regardless of company size or industry.
We’d rather see a team track five metrics consistently every week than twenty metrics reviewed once a quarter.
- Recruitify Team
Automate the Measurement, Keep the Judgment: Recruitify for Funnel Analytics
Some platforms replace the spreadsheet patchwork most TA teams stitch together to track stage conversions, source performance, and time-in-stage. They automatically timestamp every stage transition, deduplicate candidate records on intake, and surface AI-driven match scores that help explain why a source underperforms, cutting the administrative overhead of manual reporting so your team spends that time running experiments instead of rebuilding pivot tables.
The recruitment project workflow gives you a live view of pipeline health by requisition, the same weekly recruiter dashboard described above, built directly into your daily workflow rather than exported into a separate tool. Pair that with automated CV parsing and workflow automation to eliminate the manual data entry that corrupts time-in-stage calculations in the first place. Every record keeps a full audit trail, so quality-of-hire and source-effectiveness reporting stay defensible when leadership asks how the numbers were built. If your current funnel tracking still lives across three spreadsheets and a recruiter’s memory, book a demo and see what a consolidated pipeline view looks like for your own req load.
Sources
FAQ
What are funnel metrics in recruiting?
Recruitment funnel metrics measure candidate movement through each hiring stage, from application to accepted offer, using conversion rates, time-in-stage, source effectiveness, and cost-per-hire to pinpoint where qualified candidates drop out.
What are the 5 C’s of recruitment?
Definitions of the “5 C’s” vary across sources and are not a single standardized industry framework, so treat any specific list you encounter with caution rather than as an established measurement standard.
What is the 80/20 rule in recruiting?
In recruiting, a small share of sourcing channels or referral sources tend to produce the majority of quality hires, which is why segmenting source effectiveness by outcome, not just volume, matters more than tracking total applicant counts.
What is the 70/30 rule in hiring?
There is no single standardized rule consistently defined across recruiting sources; some use informal splits between active and passive candidate sourcing effort, but these are not benchmarks backed by consistent industry data.
How do you calculate stage conversion rate?
Divide the number of candidates advancing to the next stage by the number entering that stage, then multiply by 100. Multiplying every stage’s conversion rate together gives you the overall pass-through rate needed to size your top-of-funnel targets.
Recommended
News & Updates
Stay up-to-date with the latest innovations, features, and tips about Recruitify!
By providing your email address within the newsletter sign-up form, you confirm its processing to send marketing information regarding the Administrator’s products and services. The Administrator of your personal data processed for the abovementioned purposes is Recruitify Spółka z o.o., based in Warsaw, Poland (KRS 0000709889). For more information on the principles of personal data processing and the rights of data subjects, please check the Privacy Policy.

Discover More

Applicant Tracking System
Contractor Onboarding Checklist for IT Staffing Agencies
A contractor onboarding checklist for agencies and HR teams: classification, US tax forms, GDPR, least-privilege access and gates that stop work before approval.
20 Oct 2026
Discover More

Acquiring Talent
Boolean Search Strings: Operators, Examples and Templates
Learn how to write Boolean search strings for recruiting: operators, LinkedIn and Google X-ray examples, developer templates and mistakes to avoid.
19 Oct 2026
Discover More

Recruitment Process
Recruiter Productivity Metrics: 3 Measures That Expose Funnel Leaks
Choose recruiter productivity metrics that expose funnel leaks, track hiring quality and candidate experience, and show where stage delays hurt results.
18 Oct 2026
Discover More
Applicant Tracking System
Contractor Onboarding Checklist for IT Staffing Agencies
A contractor onboarding checklist for agencies and HR teams: classification, US tax forms, GDPR, least-privilege access and gates that stop work before approval.
20 Oct 2026
Discover More
Acquiring Talent
Boolean Search Strings: Operators, Examples and Templates
Learn how to write Boolean search strings for recruiting: operators, LinkedIn and Google X-ray examples, developer templates and mistakes to avoid.
19 Oct 2026
Discover More