
Last updated:
Win Renewals With 7–10 KPIs: Client Reporting for Agencies

Recruitment Process

The Recruitify Team
The fastest way to stop wasting hours on monthly client reports is to automate delivery around a compact set of 7 to 10 KPIs and a white-labeled dashboard. Agencies that chase comprehensive reporting drown clients in noise and drown their own teams in manual data pulls. The winning move is narrower: connect your data sources once, calculate a fixed set of metrics the same way every time, and deliver them through a branded, scheduled channel your client can trust without a walkthrough call.
Automating client reports by focusing on 7 to 10 key KPIs linked to client value reduces manual effort and prevents information overload.
Operational ratios such as utilization rate and effective hourly rate provide more meaningful insights into efficiency than raw totals and should be checked weekly.
Connecting data sources directly using native connectors and standardizing metrics simplifies data transformation and minimizes errors in automation workflows.
Presenting a clear, concise, and branded dashboard with a headline metric and top three changes enhances client understanding and engagement.
Using layered reporting cadence—alerts, weekly snapshots, monthly deep dives, and quarterly reviews—aligns reporting frequency with stakeholder needs and avoids information fatigue.
RecruitifyBring Recruitment Data TogetherRecruitify connects sales, recruitment, and contracting workflows in one ecosystem, supporting clearer reporting and less information chaos.Explore Recruitify
Table of Contents
What Should Client Reporting for Agencies Actually Include?
How Do You Automate the Client Reporting Workflow?
What Should You Look For in a Reporting Tool?
Building a Dashboard Clients Will Actually Open
How Often Should Agencies Send Client Reports?
How an Integrated Platform Supports the Reporting Playbook
Turning Client Feedback Into Better Reports
The Client Reporting Mistakes That Erode Trust
Getting Staff and Clients to Actually Read the Numbers
Recruitify Team Perspective on Agency Reporting Priorities
Recruitify as an Integrated Option for Reporting
Where to Verify KPI Formulas and Benchmarks
Sources
FAQ
What Should Client Reporting for Agencies Actually Include?
Client reporting for agencies works best as a short list of metrics that connect directly to what the client is paying for, not a data dump that proves how busy your team has been. Agencies that track too many metrics routinely lose client attention and dilute the metrics that actually matter, which is why a curated list of 7 to 10 essential KPIs tends to outperform exhaustive dashboards.
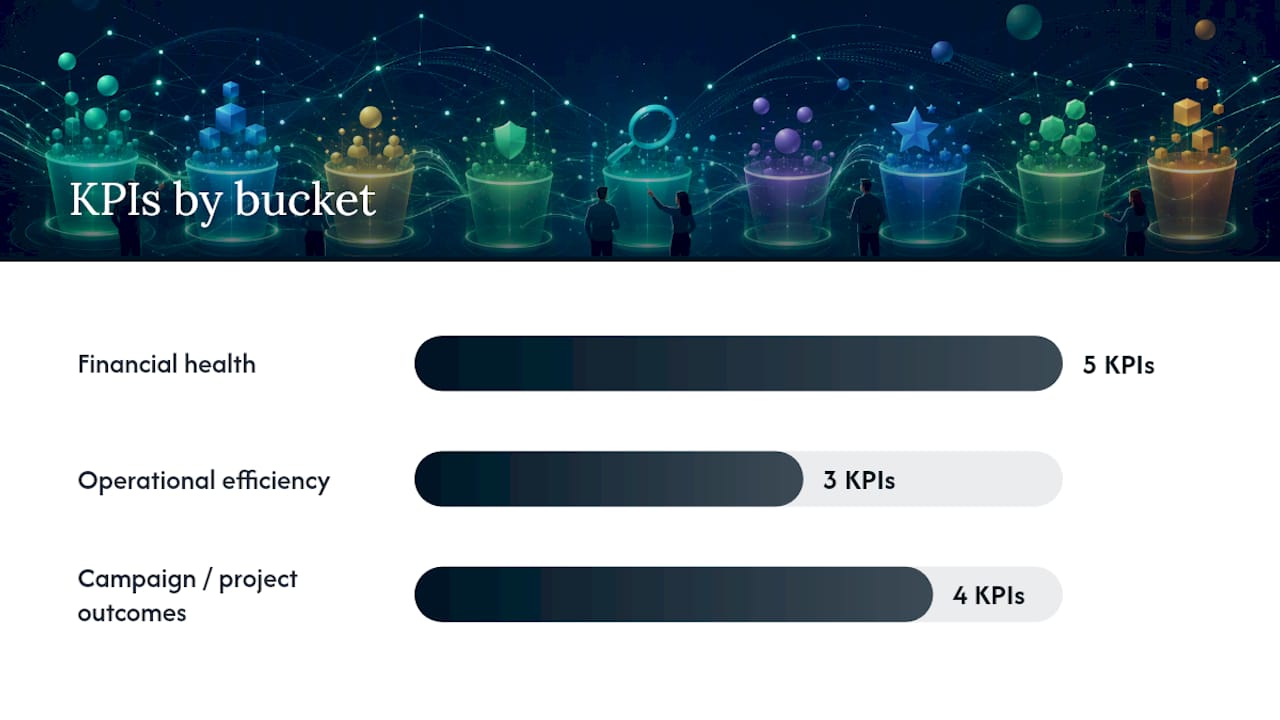
The KPIs worth including fall into three buckets: financial health, operational efficiency, and campaign or project outcomes. Here’s a starting list most agencies can adapt regardless of specialty:
Client retention rate. The percentage of clients retained over a given period, usually reported quarterly since it moves slowly.
Project margin. Revenue minus fully loaded cost per client account, reviewed monthly by account leads.
Utilization rate. The share of billable hours against total available hours, tracked weekly by operations.
Effective hourly rate. Revenue divided by hours worked, a number that exposes whether “billable” work is actually profitable.
Average revenue per client. Useful for spotting account growth or shrinkage trends over a quarter.
Customer acquisition cost (CAC). Relevant when the agency runs its own lead generation, reviewed monthly.
Conversion rate. Tracked weekly for active campaigns, tied to the specific funnel stage the client cares about.
Client lifetime value (CLTV). A slower-moving metric, useful in quarterly business reviews rather than weekly snapshots.
Campaign-level KPIs tied to client goals. Cost per lead, cost per acquisition, or engagement rate, chosen per client rather than standardized across the book.
One distinction separates agencies that report well from agencies that report a lot: ratios beat totals almost every time. A client doesn’t need to know you logged 1,200 billable hours last month. They need to know your utilization rate held at 78 percent while headcount stayed flat, because that ratio tells them efficiency, not just activity. Operational metrics like utilization rate, billable rate, and effective hourly rate predict profitability far more reliably than raw totals, and ratios reveal what’s actually driving results underneath the surface numbers.
Ownership and cadence matter as much as the metric itself. Utilization and conversion rates move fast enough to warrant weekly checks by whoever owns the account day to day. Margin, retention, and CLTV move slowly and belong in a monthly or quarterly review owned by an account director or agency principal.
Here’s how this plays out for a lead generation retainer client: the account manager tracks cost per lead and conversion rate weekly, ties both to the client’s sales pipeline data monthly, and rolls utilization and margin into a quarterly strategy conversation. The client sees campaign performance often enough to feel informed, and sees profitability signals rarely enough that they don’t get lost in noise.
Pro Tip: Pick one operational KPI (utilization or effective hourly rate) and one client-facing KPI (conversion rate or cost per lead) to report on every single client, regardless of account type. Consistency across your book makes benchmarking across clients possible, and it gives new account managers a template they can run without guessing.
How Do You Automate the Client Reporting Workflow?
Automating client reporting for agencies comes down to three stages: connect, transform, and deliver. Skipping any one of them just moves the manual labor somewhere else in the pipeline.
Connect your data sources. Prioritize direct connectors for finance systems, time tracking software, ad platforms, web analytics, and your CRM. These five sources cover the majority of KPIs listed above. Where a native connector doesn’t exist, fall back to scheduled CSV exports or a REST API pull rather than manual copy-paste, which introduces errors and breaks the moment someone goes on vacation.
Transform the raw data. Standardize naming conventions across platforms so “leads” in your CRM matches “leads” in your ad platform, not “MQLs” in one and “conversions” in the other. Compute derived metrics like margin and utilization in one place, and treat that calculation as the single source of truth for every report going forward. When you change a formula, version it and note the change date so historical comparisons stay honest.
Deliver on a schedule. Scheduled dashboards, branded PDF exports, and client portals each serve different needs. A live dashboard suits clients who like checking in themselves. A monthly PDF suits clients who want a fixed record for their own leadership. Alerting rules, like a Slack or email ping when conversion rate drops below a threshold, catch problems before the monthly review instead of during it.
Automating this pipeline saves real time. Manual report assembly commonly eats multiple days per month across an agency’s account team, and that’s time that doesn’t show up as billable work or strategic thinking. Moving connectors and scheduled delivery into phase one of any automation project, ahead of dashboard polish or advanced visualization, produces the fastest return.
Data hygiene deserves its own checklist, because automated pipelines amplify errors just as efficiently as they amplify good data. Before you trust a new automated report:
Confirm the reporting period boundaries match across every connected source (some platforms default to UTC, others to local time).
Spot-check totals against the source platform for at least two billing cycles before turning off manual verification.
Keep a rollback path, meaning a static export or screenshot, for the first quarter after automation goes live, in case a client questions a number and you need to trace it back manually.
Artificial intelligence is starting to play a role here too, particularly in surfacing anomalies or drafting narrative commentary from raw numbers. But managers report struggling to keep pace with how fast AI tools generate output, and reporting is a place where unchecked AI commentary can quietly introduce errors a client will catch before you do. Treat AI-generated insights as a first draft that a human reviews, not a final product that ships untouched.
What Should You Look For in a Reporting Tool?
Choosing reporting software for agencies comes down to seven evaluation categories, whether you’re comparing platforms or deciding to build something internal with a business intelligence tool.
Integration depth. Does it connect natively to your finance system, time tracker, ad platforms, and CRM, or will you be maintaining CSV imports indefinitely?
White-labeling. Can reports carry your agency’s logo, colors, and a custom domain, or will the client see the vendor’s branding on every login screen?
Automation scheduling. Can you set recurring delivery windows and alerting thresholds without manual triggers each cycle?
Calculated metrics support. Does the platform let you define custom formulas (like effective hourly rate) once and reuse them across every client report?
Data governance and security. How is client data segmented, who can access what, and is there an audit trail for changes to reports or underlying data?
Scalability. Does pricing and performance hold up as you add clients and data sources, or does cost jump sharply at certain thresholds?
Pricing model. Per-user, per-client, or flat platform fee, and does that model match how your agency actually grows?
Vendor claims about ease of use versus customization depth are worth testing directly rather than taking at face value. A tool that looks simple in a sales demo sometimes hits a wall the moment you need a nonstandard calculation or a client-specific dashboard layout. Before signing anything, ask vendors these questions:
Does the platform support custom KPI formulas? Can reports be fully white-labeled, including the login domain? What happens to historical data if we cancel? How are data sources authenticated and how often do connections break? Is there a sandbox to test before committing? What’s the actual cost at 10, 50, and 100 clients? Can non-technical staff build a new report without support tickets? Is there a documented audit trail for report edits? How is client data isolated between accounts? What’s the uptime history for scheduled deliveries? Can clients self-serve inside a portal, or only receive static exports? What export formats are supported? How long does onboarding typically take? Is customer support included or a paid add-on? And does the vendor provide sample exports or references you can independently verify, rather than relying only on their case studies?
Building a Dashboard Clients Will Actually Open
The best client reports front-load the takeaway instead of burying it under charts. A page-one summary should hit four things in order: the headline number, the top three changes since last period, why those changes matter, and what you recommend doing next. Everything else belongs on supporting pages the client can drill into if they want detail on a specific campaign, channel, or operational metric.
Lead with one headline metric the client already cares about, not the metric that happened to look best this month.
Limit the “top changes” section to three items maximum, ranked by business impact, not by how dramatic the percentage swing looks.
Pair every number with a one-line reason and a suggested action, since a metric without context just invites a phone call asking what it means.
Push channel-level and campaign-level breakdowns to secondary pages so the summary stays scannable.
White-labeling has become a baseline expectation rather than a premium feature. Modern reporting platforms treat white-labeling as standard, which means agencies should push for a custom domain, fully branded PDF exports, and role-based permissions so junior staff can’t accidentally edit a client-facing calculation.
Visual accessibility matters more than most agencies budget time for. Use high-contrast color pairs so charts photograph and print well, annotate any sharp spike or drop directly on the chart instead of leaving it for the narrative text, and keep axis labels short enough to read at a glance on a shared screen during a client call.
Pro Tip: Test your dashboard on a phone before sending it. A surprising number of client-side stakeholders open reports on mobile between meetings, and a dashboard that only works on a widescreen monitor loses half its audience.
How Often Should Agencies Send Client Reports?
Report cadence for agencies works best as a layered system rather than a single monthly document. Different stakeholders need different rhythms, and forcing everything into one monthly PDF means either overwhelming the client with detail or under-serving the ones who want more frequent visibility.
Real-time alerts. Reserved for threshold breaches, like a campaign budget pacing 20 percent over target or a conversion rate dropping sharply. These go out automatically, not on a fixed schedule.
Weekly snapshots. A short dashboard view covering the two or three KPIs that move fastest for that client, kept to a five-minute read.
Monthly deep dives. The full report: financial and operational KPIs, campaign breakdowns, and a written narrative explaining what changed and why.
Quarterly strategy reviews. A slower, higher-altitude conversation using CLTV, retention, and margin trends to inform the next quarter’s plan.
Each cadence needs its own template skeleton. Weekly snapshots should carry no more than three charts and zero long-form commentary. Monthly reports can run to two or three pages of narrative alongside the visuals. Quarterly reviews should open with a one-page executive summary before any supporting data.
A meeting playbook keeps the monthly or quarterly call from turning into a slide read-through: send the report as a pre-read 24 hours ahead, walk in with three talking points already chosen, log every action item during the call rather than after, and assign an owner and date to each one before the meeting ends. Set a clear SLA for delivery windows and data cutoffs, such as “reports reflect data through the last business day and arrive by the 5th of the following month,” so clients know exactly when to expect numbers and stop guessing.
How an Integrated Platform Supports the Reporting Playbook
Some integrated platforms are built around the idea that reporting shouldn’t require stitching together five disconnected tools. Such platforms consolidate applicant tracking systems, sales CRMs, and contracting modules into one ecosystem, so KPIs that matter for client reporting can live in a single dataset instead of scattered spreadsheets.
That consolidation is what drives the platform’s claimed 70 percent reduction in administrative tasks, since workflows from lead contact through contract generation run on the same automated backbone. Features like contextual matching AI and OCR-based CV parsing cut the manual data entry that normally feeds into reporting errors, while Sales Reports give account teams a ready-made view of margin and revenue without a separate export step. A built-in Cloud Drive and internal team chat keep supporting documents and report context attached to the same record instead of buried in email threads.
GDPR consent management modules and full audit trails matter specifically for reporting integrity: every KPI traces back to a documented, timestamped data point, which supports the kind of client trust that automated numbers need to hold up under scrutiny.
Turning Client Feedback Into Better Reports
Client feedback on reporting almost always falls into one of three categories: too much data, not enough context, or the wrong metric entirely. Treat each differently rather than defaulting to “add more detail,” which is the instinct that got most agencies into bloated reports in the first place.
When a client says a report feels overwhelming, the fix is usually subtraction, not reorganization. Cut the report back to the core KPI set and move everything else to an appendix they can request. When a client asks “why did this number move,” that’s a signal your narrative commentary needs to be more specific, not that you need another chart. And when a client keeps asking about a metric you’re not currently tracking, that’s a request to add it to their custom KPI list, not a sign your standard template failed.
Build a lightweight intake process for report customization requests: log the request, confirm the underlying data source exists or can be connected, and set expectations on when the change takes effect (usually the next full reporting cycle, not the current one). Avoid rebuilding a client’s entire report structure on a single request. One new chart is a fair ask. A wholesale redesign after one comment usually means the original report wasn’t validated with the client before launch.
Revisit each client’s report structure formally once or twice a year, separate from ad hoc feedback, so small requests don’t accumulate into an inconsistent, hard-to-maintain template.
The Client Reporting Mistakes That Erode Trust
The most common failure in client reporting for agencies isn’t a bad metric. It’s too many metrics delivered without context, which trains clients to skim past the report entirely instead of reading it. Once a client stops opening reports, the renewal conversation gets harder, because they’ve lost the running narrative of value the report was supposed to build.
A second frequent pitfall is inconsistent KPI definitions across time periods. If “conversion rate” gets recalculated differently in March than it was in January because someone changed a formula without documenting it, the client notices the discontinuity even if they can’t articulate why the numbers feel off. Keep a single canonical formula for every KPI and version any changes so historical reports stay comparable.
A third pitfall is treating the report as the finish line instead of the start of a conversation. A report that lands in an inbox with no accompanying call or written recommendation reads as an obligation fulfilled, not a partnership maintained. Pair every report, even the automated weekly ones, with at least a short written takeaway.
Finally, agencies routinely under-invest in verifying vendor automation claims before switching tools. Ask for sample exports and audit trails during any vendor evaluation rather than trusting marketing copy, since vendor case studies report time savings that don’t always hold up once your specific data sources are connected.
Getting Staff and Clients to Actually Read the Numbers
Training on client reporting for agencies needs to happen on both sides of the relationship, because a perfectly built report still fails if nobody interprets it correctly.
Internally, new account managers should shadow at least one full reporting cycle before owning a client relationship solo, watching how a senior team member turns a KPI shift into a specific recommendation rather than a vague observation. Document your KPI formulas in an internal wiki so every account manager calculates margin or utilization the same way, and review that documentation whenever a formula changes.
On the client side, the first report for any new account should include a short walkthrough, ideally live, explaining what each KPI means and why it was chosen for their account specifically. Skipping this step is a common reason clients misread a metric or fixate on the wrong number during a review call. A one-page glossary attached to the first few reports, defining terms like utilization rate or effective hourly rate in plain language, reduces the number of “what does this mean” emails significantly.
Revisit training periodically, not just at onboarding. Client-side stakeholders change, and a new marketing director inheriting a reporting relationship benefits from the same walkthrough the original contact received.
Recruitify Team Perspective on Agency Reporting Priorities
Most agencies overcorrect in one of two directions: they either report everything and lose the client’s attention, or they report so little that renewal conversations lack evidence. The pragmatic middle is the compact KPI set built on automated, auditable data, not a bigger dashboard. Agencies that make this shift typically expect to reclaim meaningful hours per month previously spent on manual assembly, and to walk into renewal conversations with a clearer, defensible story instead of a spreadsheet nobody trusts. For agencies ready to consolidate that data pipeline instead of patching it together, an integrated platform is worth serious consideration.
- Recruitify Team
Recruitify as an Integrated Option for Reporting
Recruitify is the alternative to juggling five disconnected tools for agency reporting: one ecosystem where your ATS, CRM, and contracting data already share a single source of truth, so the KPIs in your client reports don’t require a manual reconciliation step before every send.
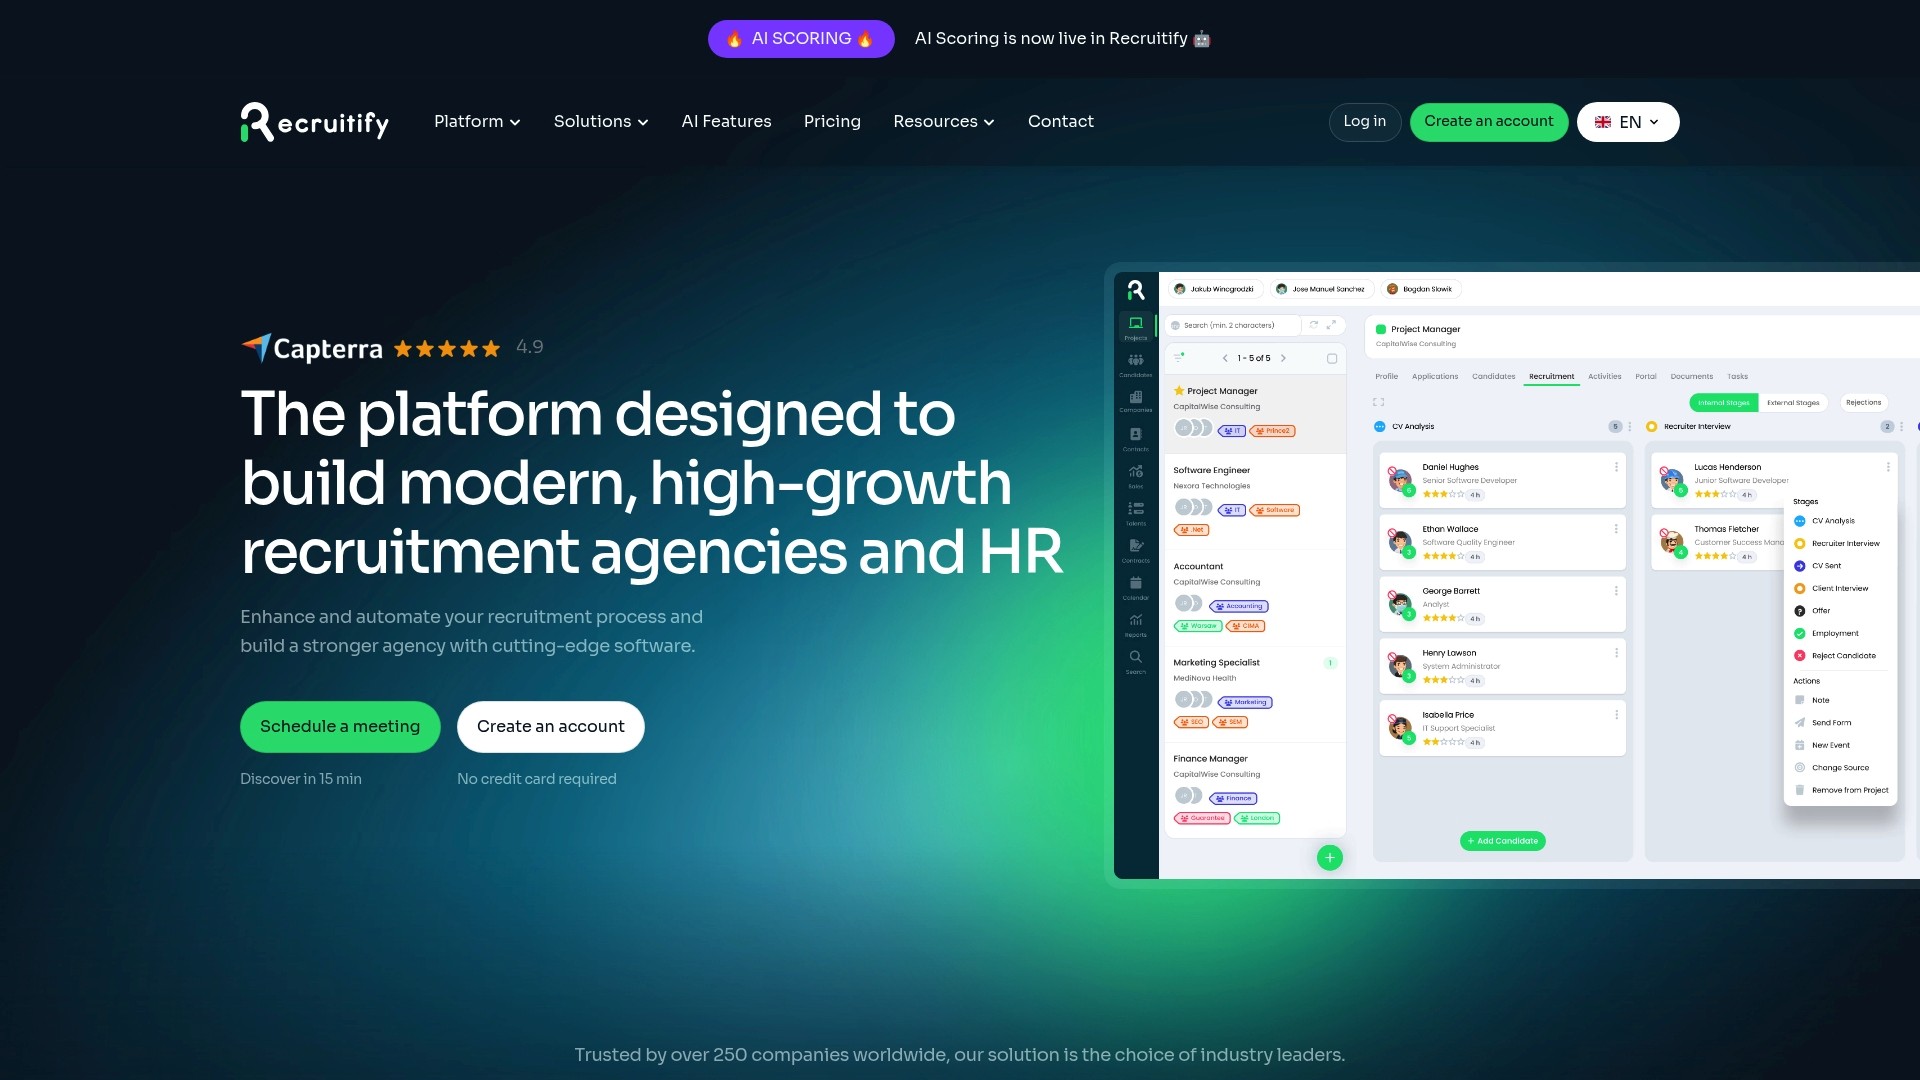
The platform’s Sales Reports pull margin and revenue directly from the same pipeline your recruiters work in daily, its contextual matching AI and OCR parsing cut the data entry errors that quietly corrupt reporting accuracy, and its GDPR audit trail gives clients a documented, timestamped source for every number you present. For agencies, the Recruitment Agencies plan runs €79 per month per user, and the HR Team plan runs €69 per month per user, both on the same pricing page where Enterprise pricing is available on request.
If you’re ready to stop stitching spreadsheets together, three next steps are worth taking this week: book a demo to see how the reporting data flows in practice, start a free trial to connect your own pipeline, or explore the automation features that feed directly into the KPI set this guide recommends.
Where to Verify KPI Formulas and Benchmarks
For agencies building or refining a reporting framework, a handful of sources are worth bookmarking directly. NetSuite’s KPI guide lays out the formulas and reasoning behind the 7 to 10 KPI recommendation. Pike’s profitability metrics guide breaks down operational ratios like utilization and effective hourly rate. ClicData’s automation guide walks through the connect, transform, and deliver framework in more technical depth. Databox’s white-label roundup is useful for understanding current branding expectations across reporting platforms.
Sources
Best white label reporting tools for marketing agencies | Databox
Automated Client Reporting for Marketing Agencies | ClicData
Managers are struggling to keep up with the AI productivity boom | HBR
FAQ
What Are the Best Practices for Client Reporting?
The strongest practice is limiting reports to a curated set of 7 to 10 KPIs tied directly to what the client is paying for, then automating data collection so numbers stay consistent every cycle. Pair every report with a short narrative explaining what changed and why, and keep formulas versioned so historical comparisons remain trustworthy.
What Are the Top Reporting Tools for Agencies?
Rather than naming specific vendors, evaluate any tool against seven categories: integration depth, white-labeling, automation scheduling, calculated metrics support, data governance, scalability, and pricing model. Agencies already running an integrated platform like Recruitify can pull margin and pipeline data directly from Sales Reports without adding a separate reporting tool to the stack.
What Are the Three Types of Reporting Agencies Use?
Most agencies run three layers: real-time alerts for threshold breaches, recurring dashboards (weekly or monthly) for ongoing visibility, and deeper strategic reviews (monthly or quarterly) that connect performance to business outcomes. Each layer serves a different stakeholder need and shouldn’t be collapsed into a single document.
What Makes a Good Marketing Dashboard for Agencies?
A good dashboard leads with one headline metric, ranks the top three changes since the last period, and explains why each matters before offering a recommended next step. Everything else, including channel and campaign-level detail, belongs on supporting pages a client can open if they want more depth, following the summary-first pattern that white-labeled reporting tools are increasingly built around.
How Much Does Recruitify Cost for Agency Reporting?
Recruitify’s Recruitment Agencies plan is priced at €79 per month per user, and the HR Team plan runs €69 per month per user, both listed on the pricing page. Enterprise pricing is available on request through the same page.
Recommended


News & Updates
Stay up-to-date with the latest innovations, features, and tips about Recruitify!
By providing your email address within the newsletter sign-up form, you confirm its processing to send marketing information regarding the Administrator’s products and services. The Administrator of your personal data processed for the abovementioned purposes is Recruitify Spółka z o.o., based in Warsaw, Poland (KRS 0000709889). For more information on the principles of personal data processing and the rights of data subjects, please check the Privacy Policy.

Last updated:
Win Renewals With 7–10 KPIs: Client Reporting for Agencies
Recruitment Process
The Recruitify Team
The fastest way to stop wasting hours on monthly client reports is to automate delivery around a compact set of 7 to 10 KPIs and a white-labeled dashboard. Agencies that chase comprehensive reporting drown clients in noise and drown their own teams in manual data pulls. The winning move is narrower: connect your data sources once, calculate a fixed set of metrics the same way every time, and deliver them through a branded, scheduled channel your client can trust without a walkthrough call.
Automating client reports by focusing on 7 to 10 key KPIs linked to client value reduces manual effort and prevents information overload.
Operational ratios such as utilization rate and effective hourly rate provide more meaningful insights into efficiency than raw totals and should be checked weekly.
Connecting data sources directly using native connectors and standardizing metrics simplifies data transformation and minimizes errors in automation workflows.
Presenting a clear, concise, and branded dashboard with a headline metric and top three changes enhances client understanding and engagement.
Using layered reporting cadence—alerts, weekly snapshots, monthly deep dives, and quarterly reviews—aligns reporting frequency with stakeholder needs and avoids information fatigue.
RecruitifyBring Recruitment Data TogetherRecruitify connects sales, recruitment, and contracting workflows in one ecosystem, supporting clearer reporting and less information chaos.Explore Recruitify
Table of Contents
What Should Client Reporting for Agencies Actually Include?
How Do You Automate the Client Reporting Workflow?
What Should You Look For in a Reporting Tool?
Building a Dashboard Clients Will Actually Open
How Often Should Agencies Send Client Reports?
How an Integrated Platform Supports the Reporting Playbook
Turning Client Feedback Into Better Reports
The Client Reporting Mistakes That Erode Trust
Getting Staff and Clients to Actually Read the Numbers
Recruitify Team Perspective on Agency Reporting Priorities
Recruitify as an Integrated Option for Reporting
Where to Verify KPI Formulas and Benchmarks
Sources
FAQ
What Should Client Reporting for Agencies Actually Include?
Client reporting for agencies works best as a short list of metrics that connect directly to what the client is paying for, not a data dump that proves how busy your team has been. Agencies that track too many metrics routinely lose client attention and dilute the metrics that actually matter, which is why a curated list of 7 to 10 essential KPIs tends to outperform exhaustive dashboards.
The KPIs worth including fall into three buckets: financial health, operational efficiency, and campaign or project outcomes. Here’s a starting list most agencies can adapt regardless of specialty:
Client retention rate. The percentage of clients retained over a given period, usually reported quarterly since it moves slowly.
Project margin. Revenue minus fully loaded cost per client account, reviewed monthly by account leads.
Utilization rate. The share of billable hours against total available hours, tracked weekly by operations.
Effective hourly rate. Revenue divided by hours worked, a number that exposes whether “billable” work is actually profitable.
Average revenue per client. Useful for spotting account growth or shrinkage trends over a quarter.
Customer acquisition cost (CAC). Relevant when the agency runs its own lead generation, reviewed monthly.
Conversion rate. Tracked weekly for active campaigns, tied to the specific funnel stage the client cares about.
Client lifetime value (CLTV). A slower-moving metric, useful in quarterly business reviews rather than weekly snapshots.
Campaign-level KPIs tied to client goals. Cost per lead, cost per acquisition, or engagement rate, chosen per client rather than standardized across the book.
One distinction separates agencies that report well from agencies that report a lot: ratios beat totals almost every time. A client doesn’t need to know you logged 1,200 billable hours last month. They need to know your utilization rate held at 78 percent while headcount stayed flat, because that ratio tells them efficiency, not just activity. Operational metrics like utilization rate, billable rate, and effective hourly rate predict profitability far more reliably than raw totals, and ratios reveal what’s actually driving results underneath the surface numbers.
Ownership and cadence matter as much as the metric itself. Utilization and conversion rates move fast enough to warrant weekly checks by whoever owns the account day to day. Margin, retention, and CLTV move slowly and belong in a monthly or quarterly review owned by an account director or agency principal.
Here’s how this plays out for a lead generation retainer client: the account manager tracks cost per lead and conversion rate weekly, ties both to the client’s sales pipeline data monthly, and rolls utilization and margin into a quarterly strategy conversation. The client sees campaign performance often enough to feel informed, and sees profitability signals rarely enough that they don’t get lost in noise.
Pro Tip: Pick one operational KPI (utilization or effective hourly rate) and one client-facing KPI (conversion rate or cost per lead) to report on every single client, regardless of account type. Consistency across your book makes benchmarking across clients possible, and it gives new account managers a template they can run without guessing.
How Do You Automate the Client Reporting Workflow?
Automating client reporting for agencies comes down to three stages: connect, transform, and deliver. Skipping any one of them just moves the manual labor somewhere else in the pipeline.
Connect your data sources. Prioritize direct connectors for finance systems, time tracking software, ad platforms, web analytics, and your CRM. These five sources cover the majority of KPIs listed above. Where a native connector doesn’t exist, fall back to scheduled CSV exports or a REST API pull rather than manual copy-paste, which introduces errors and breaks the moment someone goes on vacation.
Transform the raw data. Standardize naming conventions across platforms so “leads” in your CRM matches “leads” in your ad platform, not “MQLs” in one and “conversions” in the other. Compute derived metrics like margin and utilization in one place, and treat that calculation as the single source of truth for every report going forward. When you change a formula, version it and note the change date so historical comparisons stay honest.
Deliver on a schedule. Scheduled dashboards, branded PDF exports, and client portals each serve different needs. A live dashboard suits clients who like checking in themselves. A monthly PDF suits clients who want a fixed record for their own leadership. Alerting rules, like a Slack or email ping when conversion rate drops below a threshold, catch problems before the monthly review instead of during it.
Automating this pipeline saves real time. Manual report assembly commonly eats multiple days per month across an agency’s account team, and that’s time that doesn’t show up as billable work or strategic thinking. Moving connectors and scheduled delivery into phase one of any automation project, ahead of dashboard polish or advanced visualization, produces the fastest return.
Data hygiene deserves its own checklist, because automated pipelines amplify errors just as efficiently as they amplify good data. Before you trust a new automated report:
Confirm the reporting period boundaries match across every connected source (some platforms default to UTC, others to local time).
Spot-check totals against the source platform for at least two billing cycles before turning off manual verification.
Keep a rollback path, meaning a static export or screenshot, for the first quarter after automation goes live, in case a client questions a number and you need to trace it back manually.
Artificial intelligence is starting to play a role here too, particularly in surfacing anomalies or drafting narrative commentary from raw numbers. But managers report struggling to keep pace with how fast AI tools generate output, and reporting is a place where unchecked AI commentary can quietly introduce errors a client will catch before you do. Treat AI-generated insights as a first draft that a human reviews, not a final product that ships untouched.
What Should You Look For in a Reporting Tool?
Choosing reporting software for agencies comes down to seven evaluation categories, whether you’re comparing platforms or deciding to build something internal with a business intelligence tool.
Integration depth. Does it connect natively to your finance system, time tracker, ad platforms, and CRM, or will you be maintaining CSV imports indefinitely?
White-labeling. Can reports carry your agency’s logo, colors, and a custom domain, or will the client see the vendor’s branding on every login screen?
Automation scheduling. Can you set recurring delivery windows and alerting thresholds without manual triggers each cycle?
Calculated metrics support. Does the platform let you define custom formulas (like effective hourly rate) once and reuse them across every client report?
Data governance and security. How is client data segmented, who can access what, and is there an audit trail for changes to reports or underlying data?
Scalability. Does pricing and performance hold up as you add clients and data sources, or does cost jump sharply at certain thresholds?
Pricing model. Per-user, per-client, or flat platform fee, and does that model match how your agency actually grows?
Vendor claims about ease of use versus customization depth are worth testing directly rather than taking at face value. A tool that looks simple in a sales demo sometimes hits a wall the moment you need a nonstandard calculation or a client-specific dashboard layout. Before signing anything, ask vendors these questions:
Does the platform support custom KPI formulas? Can reports be fully white-labeled, including the login domain? What happens to historical data if we cancel? How are data sources authenticated and how often do connections break? Is there a sandbox to test before committing? What’s the actual cost at 10, 50, and 100 clients? Can non-technical staff build a new report without support tickets? Is there a documented audit trail for report edits? How is client data isolated between accounts? What’s the uptime history for scheduled deliveries? Can clients self-serve inside a portal, or only receive static exports? What export formats are supported? How long does onboarding typically take? Is customer support included or a paid add-on? And does the vendor provide sample exports or references you can independently verify, rather than relying only on their case studies?
Building a Dashboard Clients Will Actually Open
The best client reports front-load the takeaway instead of burying it under charts. A page-one summary should hit four things in order: the headline number, the top three changes since last period, why those changes matter, and what you recommend doing next. Everything else belongs on supporting pages the client can drill into if they want detail on a specific campaign, channel, or operational metric.
Lead with one headline metric the client already cares about, not the metric that happened to look best this month.
Limit the “top changes” section to three items maximum, ranked by business impact, not by how dramatic the percentage swing looks.
Pair every number with a one-line reason and a suggested action, since a metric without context just invites a phone call asking what it means.
Push channel-level and campaign-level breakdowns to secondary pages so the summary stays scannable.
White-labeling has become a baseline expectation rather than a premium feature. Modern reporting platforms treat white-labeling as standard, which means agencies should push for a custom domain, fully branded PDF exports, and role-based permissions so junior staff can’t accidentally edit a client-facing calculation.
Visual accessibility matters more than most agencies budget time for. Use high-contrast color pairs so charts photograph and print well, annotate any sharp spike or drop directly on the chart instead of leaving it for the narrative text, and keep axis labels short enough to read at a glance on a shared screen during a client call.
Pro Tip: Test your dashboard on a phone before sending it. A surprising number of client-side stakeholders open reports on mobile between meetings, and a dashboard that only works on a widescreen monitor loses half its audience.
How Often Should Agencies Send Client Reports?
Report cadence for agencies works best as a layered system rather than a single monthly document. Different stakeholders need different rhythms, and forcing everything into one monthly PDF means either overwhelming the client with detail or under-serving the ones who want more frequent visibility.
Real-time alerts. Reserved for threshold breaches, like a campaign budget pacing 20 percent over target or a conversion rate dropping sharply. These go out automatically, not on a fixed schedule.
Weekly snapshots. A short dashboard view covering the two or three KPIs that move fastest for that client, kept to a five-minute read.
Monthly deep dives. The full report: financial and operational KPIs, campaign breakdowns, and a written narrative explaining what changed and why.
Quarterly strategy reviews. A slower, higher-altitude conversation using CLTV, retention, and margin trends to inform the next quarter’s plan.
Each cadence needs its own template skeleton. Weekly snapshots should carry no more than three charts and zero long-form commentary. Monthly reports can run to two or three pages of narrative alongside the visuals. Quarterly reviews should open with a one-page executive summary before any supporting data.
A meeting playbook keeps the monthly or quarterly call from turning into a slide read-through: send the report as a pre-read 24 hours ahead, walk in with three talking points already chosen, log every action item during the call rather than after, and assign an owner and date to each one before the meeting ends. Set a clear SLA for delivery windows and data cutoffs, such as “reports reflect data through the last business day and arrive by the 5th of the following month,” so clients know exactly when to expect numbers and stop guessing.
How an Integrated Platform Supports the Reporting Playbook
Some integrated platforms are built around the idea that reporting shouldn’t require stitching together five disconnected tools. Such platforms consolidate applicant tracking systems, sales CRMs, and contracting modules into one ecosystem, so KPIs that matter for client reporting can live in a single dataset instead of scattered spreadsheets.
That consolidation is what drives the platform’s claimed 70 percent reduction in administrative tasks, since workflows from lead contact through contract generation run on the same automated backbone. Features like contextual matching AI and OCR-based CV parsing cut the manual data entry that normally feeds into reporting errors, while Sales Reports give account teams a ready-made view of margin and revenue without a separate export step. A built-in Cloud Drive and internal team chat keep supporting documents and report context attached to the same record instead of buried in email threads.
GDPR consent management modules and full audit trails matter specifically for reporting integrity: every KPI traces back to a documented, timestamped data point, which supports the kind of client trust that automated numbers need to hold up under scrutiny.
Turning Client Feedback Into Better Reports
Client feedback on reporting almost always falls into one of three categories: too much data, not enough context, or the wrong metric entirely. Treat each differently rather than defaulting to “add more detail,” which is the instinct that got most agencies into bloated reports in the first place.
When a client says a report feels overwhelming, the fix is usually subtraction, not reorganization. Cut the report back to the core KPI set and move everything else to an appendix they can request. When a client asks “why did this number move,” that’s a signal your narrative commentary needs to be more specific, not that you need another chart. And when a client keeps asking about a metric you’re not currently tracking, that’s a request to add it to their custom KPI list, not a sign your standard template failed.
Build a lightweight intake process for report customization requests: log the request, confirm the underlying data source exists or can be connected, and set expectations on when the change takes effect (usually the next full reporting cycle, not the current one). Avoid rebuilding a client’s entire report structure on a single request. One new chart is a fair ask. A wholesale redesign after one comment usually means the original report wasn’t validated with the client before launch.
Revisit each client’s report structure formally once or twice a year, separate from ad hoc feedback, so small requests don’t accumulate into an inconsistent, hard-to-maintain template.
The Client Reporting Mistakes That Erode Trust
The most common failure in client reporting for agencies isn’t a bad metric. It’s too many metrics delivered without context, which trains clients to skim past the report entirely instead of reading it. Once a client stops opening reports, the renewal conversation gets harder, because they’ve lost the running narrative of value the report was supposed to build.
A second frequent pitfall is inconsistent KPI definitions across time periods. If “conversion rate” gets recalculated differently in March than it was in January because someone changed a formula without documenting it, the client notices the discontinuity even if they can’t articulate why the numbers feel off. Keep a single canonical formula for every KPI and version any changes so historical reports stay comparable.
A third pitfall is treating the report as the finish line instead of the start of a conversation. A report that lands in an inbox with no accompanying call or written recommendation reads as an obligation fulfilled, not a partnership maintained. Pair every report, even the automated weekly ones, with at least a short written takeaway.
Finally, agencies routinely under-invest in verifying vendor automation claims before switching tools. Ask for sample exports and audit trails during any vendor evaluation rather than trusting marketing copy, since vendor case studies report time savings that don’t always hold up once your specific data sources are connected.
Getting Staff and Clients to Actually Read the Numbers
Training on client reporting for agencies needs to happen on both sides of the relationship, because a perfectly built report still fails if nobody interprets it correctly.
Internally, new account managers should shadow at least one full reporting cycle before owning a client relationship solo, watching how a senior team member turns a KPI shift into a specific recommendation rather than a vague observation. Document your KPI formulas in an internal wiki so every account manager calculates margin or utilization the same way, and review that documentation whenever a formula changes.
On the client side, the first report for any new account should include a short walkthrough, ideally live, explaining what each KPI means and why it was chosen for their account specifically. Skipping this step is a common reason clients misread a metric or fixate on the wrong number during a review call. A one-page glossary attached to the first few reports, defining terms like utilization rate or effective hourly rate in plain language, reduces the number of “what does this mean” emails significantly.
Revisit training periodically, not just at onboarding. Client-side stakeholders change, and a new marketing director inheriting a reporting relationship benefits from the same walkthrough the original contact received.
Recruitify Team Perspective on Agency Reporting Priorities
Most agencies overcorrect in one of two directions: they either report everything and lose the client’s attention, or they report so little that renewal conversations lack evidence. The pragmatic middle is the compact KPI set built on automated, auditable data, not a bigger dashboard. Agencies that make this shift typically expect to reclaim meaningful hours per month previously spent on manual assembly, and to walk into renewal conversations with a clearer, defensible story instead of a spreadsheet nobody trusts. For agencies ready to consolidate that data pipeline instead of patching it together, an integrated platform is worth serious consideration.
- Recruitify Team
Recruitify as an Integrated Option for Reporting
Recruitify is the alternative to juggling five disconnected tools for agency reporting: one ecosystem where your ATS, CRM, and contracting data already share a single source of truth, so the KPIs in your client reports don’t require a manual reconciliation step before every send.
The platform’s Sales Reports pull margin and revenue directly from the same pipeline your recruiters work in daily, its contextual matching AI and OCR parsing cut the data entry errors that quietly corrupt reporting accuracy, and its GDPR audit trail gives clients a documented, timestamped source for every number you present. For agencies, the Recruitment Agencies plan runs €79 per month per user, and the HR Team plan runs €69 per month per user, both on the same pricing page where Enterprise pricing is available on request.
If you’re ready to stop stitching spreadsheets together, three next steps are worth taking this week: book a demo to see how the reporting data flows in practice, start a free trial to connect your own pipeline, or explore the automation features that feed directly into the KPI set this guide recommends.
Where to Verify KPI Formulas and Benchmarks
For agencies building or refining a reporting framework, a handful of sources are worth bookmarking directly. NetSuite’s KPI guide lays out the formulas and reasoning behind the 7 to 10 KPI recommendation. Pike’s profitability metrics guide breaks down operational ratios like utilization and effective hourly rate. ClicData’s automation guide walks through the connect, transform, and deliver framework in more technical depth. Databox’s white-label roundup is useful for understanding current branding expectations across reporting platforms.
Sources
Best white label reporting tools for marketing agencies | Databox
Automated Client Reporting for Marketing Agencies | ClicData
Managers are struggling to keep up with the AI productivity boom | HBR
FAQ
What Are the Best Practices for Client Reporting?
The strongest practice is limiting reports to a curated set of 7 to 10 KPIs tied directly to what the client is paying for, then automating data collection so numbers stay consistent every cycle. Pair every report with a short narrative explaining what changed and why, and keep formulas versioned so historical comparisons remain trustworthy.
What Are the Top Reporting Tools for Agencies?
Rather than naming specific vendors, evaluate any tool against seven categories: integration depth, white-labeling, automation scheduling, calculated metrics support, data governance, scalability, and pricing model. Agencies already running an integrated platform like Recruitify can pull margin and pipeline data directly from Sales Reports without adding a separate reporting tool to the stack.
What Are the Three Types of Reporting Agencies Use?
Most agencies run three layers: real-time alerts for threshold breaches, recurring dashboards (weekly or monthly) for ongoing visibility, and deeper strategic reviews (monthly or quarterly) that connect performance to business outcomes. Each layer serves a different stakeholder need and shouldn’t be collapsed into a single document.
What Makes a Good Marketing Dashboard for Agencies?
A good dashboard leads with one headline metric, ranks the top three changes since the last period, and explains why each matters before offering a recommended next step. Everything else, including channel and campaign-level detail, belongs on supporting pages a client can open if they want more depth, following the summary-first pattern that white-labeled reporting tools are increasingly built around.
How Much Does Recruitify Cost for Agency Reporting?
Recruitify’s Recruitment Agencies plan is priced at €79 per month per user, and the HR Team plan runs €69 per month per user, both listed on the pricing page. Enterprise pricing is available on request through the same page.
Recommended
News & Updates
Stay up-to-date with the latest innovations, features, and tips about Recruitify!
By providing your email address within the newsletter sign-up form, you confirm its processing to send marketing information regarding the Administrator’s products and services. The Administrator of your personal data processed for the abovementioned purposes is Recruitify Spółka z o.o., based in Warsaw, Poland (KRS 0000709889). For more information on the principles of personal data processing and the rights of data subjects, please check the Privacy Policy.
Last updated:
Win Renewals With 7–10 KPIs: Client Reporting for Agencies
Recruitment Process
The Recruitify Team
The fastest way to stop wasting hours on monthly client reports is to automate delivery around a compact set of 7 to 10 KPIs and a white-labeled dashboard. Agencies that chase comprehensive reporting drown clients in noise and drown their own teams in manual data pulls. The winning move is narrower: connect your data sources once, calculate a fixed set of metrics the same way every time, and deliver them through a branded, scheduled channel your client can trust without a walkthrough call.
Automating client reports by focusing on 7 to 10 key KPIs linked to client value reduces manual effort and prevents information overload.
Operational ratios such as utilization rate and effective hourly rate provide more meaningful insights into efficiency than raw totals and should be checked weekly.
Connecting data sources directly using native connectors and standardizing metrics simplifies data transformation and minimizes errors in automation workflows.
Presenting a clear, concise, and branded dashboard with a headline metric and top three changes enhances client understanding and engagement.
Using layered reporting cadence—alerts, weekly snapshots, monthly deep dives, and quarterly reviews—aligns reporting frequency with stakeholder needs and avoids information fatigue.
RecruitifyBring Recruitment Data TogetherRecruitify connects sales, recruitment, and contracting workflows in one ecosystem, supporting clearer reporting and less information chaos.Explore Recruitify
Table of Contents
What Should Client Reporting for Agencies Actually Include?
How Do You Automate the Client Reporting Workflow?
What Should You Look For in a Reporting Tool?
Building a Dashboard Clients Will Actually Open
How Often Should Agencies Send Client Reports?
How an Integrated Platform Supports the Reporting Playbook
Turning Client Feedback Into Better Reports
The Client Reporting Mistakes That Erode Trust
Getting Staff and Clients to Actually Read the Numbers
Recruitify Team Perspective on Agency Reporting Priorities
Recruitify as an Integrated Option for Reporting
Where to Verify KPI Formulas and Benchmarks
Sources
FAQ
What Should Client Reporting for Agencies Actually Include?
Client reporting for agencies works best as a short list of metrics that connect directly to what the client is paying for, not a data dump that proves how busy your team has been. Agencies that track too many metrics routinely lose client attention and dilute the metrics that actually matter, which is why a curated list of 7 to 10 essential KPIs tends to outperform exhaustive dashboards.
The KPIs worth including fall into three buckets: financial health, operational efficiency, and campaign or project outcomes. Here’s a starting list most agencies can adapt regardless of specialty:
Client retention rate. The percentage of clients retained over a given period, usually reported quarterly since it moves slowly.
Project margin. Revenue minus fully loaded cost per client account, reviewed monthly by account leads.
Utilization rate. The share of billable hours against total available hours, tracked weekly by operations.
Effective hourly rate. Revenue divided by hours worked, a number that exposes whether “billable” work is actually profitable.
Average revenue per client. Useful for spotting account growth or shrinkage trends over a quarter.
Customer acquisition cost (CAC). Relevant when the agency runs its own lead generation, reviewed monthly.
Conversion rate. Tracked weekly for active campaigns, tied to the specific funnel stage the client cares about.
Client lifetime value (CLTV). A slower-moving metric, useful in quarterly business reviews rather than weekly snapshots.
Campaign-level KPIs tied to client goals. Cost per lead, cost per acquisition, or engagement rate, chosen per client rather than standardized across the book.
One distinction separates agencies that report well from agencies that report a lot: ratios beat totals almost every time. A client doesn’t need to know you logged 1,200 billable hours last month. They need to know your utilization rate held at 78 percent while headcount stayed flat, because that ratio tells them efficiency, not just activity. Operational metrics like utilization rate, billable rate, and effective hourly rate predict profitability far more reliably than raw totals, and ratios reveal what’s actually driving results underneath the surface numbers.
Ownership and cadence matter as much as the metric itself. Utilization and conversion rates move fast enough to warrant weekly checks by whoever owns the account day to day. Margin, retention, and CLTV move slowly and belong in a monthly or quarterly review owned by an account director or agency principal.
Here’s how this plays out for a lead generation retainer client: the account manager tracks cost per lead and conversion rate weekly, ties both to the client’s sales pipeline data monthly, and rolls utilization and margin into a quarterly strategy conversation. The client sees campaign performance often enough to feel informed, and sees profitability signals rarely enough that they don’t get lost in noise.
Pro Tip: Pick one operational KPI (utilization or effective hourly rate) and one client-facing KPI (conversion rate or cost per lead) to report on every single client, regardless of account type. Consistency across your book makes benchmarking across clients possible, and it gives new account managers a template they can run without guessing.
How Do You Automate the Client Reporting Workflow?
Automating client reporting for agencies comes down to three stages: connect, transform, and deliver. Skipping any one of them just moves the manual labor somewhere else in the pipeline.
Connect your data sources. Prioritize direct connectors for finance systems, time tracking software, ad platforms, web analytics, and your CRM. These five sources cover the majority of KPIs listed above. Where a native connector doesn’t exist, fall back to scheduled CSV exports or a REST API pull rather than manual copy-paste, which introduces errors and breaks the moment someone goes on vacation.
Transform the raw data. Standardize naming conventions across platforms so “leads” in your CRM matches “leads” in your ad platform, not “MQLs” in one and “conversions” in the other. Compute derived metrics like margin and utilization in one place, and treat that calculation as the single source of truth for every report going forward. When you change a formula, version it and note the change date so historical comparisons stay honest.
Deliver on a schedule. Scheduled dashboards, branded PDF exports, and client portals each serve different needs. A live dashboard suits clients who like checking in themselves. A monthly PDF suits clients who want a fixed record for their own leadership. Alerting rules, like a Slack or email ping when conversion rate drops below a threshold, catch problems before the monthly review instead of during it.
Automating this pipeline saves real time. Manual report assembly commonly eats multiple days per month across an agency’s account team, and that’s time that doesn’t show up as billable work or strategic thinking. Moving connectors and scheduled delivery into phase one of any automation project, ahead of dashboard polish or advanced visualization, produces the fastest return.
Data hygiene deserves its own checklist, because automated pipelines amplify errors just as efficiently as they amplify good data. Before you trust a new automated report:
Confirm the reporting period boundaries match across every connected source (some platforms default to UTC, others to local time).
Spot-check totals against the source platform for at least two billing cycles before turning off manual verification.
Keep a rollback path, meaning a static export or screenshot, for the first quarter after automation goes live, in case a client questions a number and you need to trace it back manually.
Artificial intelligence is starting to play a role here too, particularly in surfacing anomalies or drafting narrative commentary from raw numbers. But managers report struggling to keep pace with how fast AI tools generate output, and reporting is a place where unchecked AI commentary can quietly introduce errors a client will catch before you do. Treat AI-generated insights as a first draft that a human reviews, not a final product that ships untouched.
What Should You Look For in a Reporting Tool?
Choosing reporting software for agencies comes down to seven evaluation categories, whether you’re comparing platforms or deciding to build something internal with a business intelligence tool.
Integration depth. Does it connect natively to your finance system, time tracker, ad platforms, and CRM, or will you be maintaining CSV imports indefinitely?
White-labeling. Can reports carry your agency’s logo, colors, and a custom domain, or will the client see the vendor’s branding on every login screen?
Automation scheduling. Can you set recurring delivery windows and alerting thresholds without manual triggers each cycle?
Calculated metrics support. Does the platform let you define custom formulas (like effective hourly rate) once and reuse them across every client report?
Data governance and security. How is client data segmented, who can access what, and is there an audit trail for changes to reports or underlying data?
Scalability. Does pricing and performance hold up as you add clients and data sources, or does cost jump sharply at certain thresholds?
Pricing model. Per-user, per-client, or flat platform fee, and does that model match how your agency actually grows?
Vendor claims about ease of use versus customization depth are worth testing directly rather than taking at face value. A tool that looks simple in a sales demo sometimes hits a wall the moment you need a nonstandard calculation or a client-specific dashboard layout. Before signing anything, ask vendors these questions:
Does the platform support custom KPI formulas? Can reports be fully white-labeled, including the login domain? What happens to historical data if we cancel? How are data sources authenticated and how often do connections break? Is there a sandbox to test before committing? What’s the actual cost at 10, 50, and 100 clients? Can non-technical staff build a new report without support tickets? Is there a documented audit trail for report edits? How is client data isolated between accounts? What’s the uptime history for scheduled deliveries? Can clients self-serve inside a portal, or only receive static exports? What export formats are supported? How long does onboarding typically take? Is customer support included or a paid add-on? And does the vendor provide sample exports or references you can independently verify, rather than relying only on their case studies?
Building a Dashboard Clients Will Actually Open
The best client reports front-load the takeaway instead of burying it under charts. A page-one summary should hit four things in order: the headline number, the top three changes since last period, why those changes matter, and what you recommend doing next. Everything else belongs on supporting pages the client can drill into if they want detail on a specific campaign, channel, or operational metric.
Lead with one headline metric the client already cares about, not the metric that happened to look best this month.
Limit the “top changes” section to three items maximum, ranked by business impact, not by how dramatic the percentage swing looks.
Pair every number with a one-line reason and a suggested action, since a metric without context just invites a phone call asking what it means.
Push channel-level and campaign-level breakdowns to secondary pages so the summary stays scannable.
White-labeling has become a baseline expectation rather than a premium feature. Modern reporting platforms treat white-labeling as standard, which means agencies should push for a custom domain, fully branded PDF exports, and role-based permissions so junior staff can’t accidentally edit a client-facing calculation.
Visual accessibility matters more than most agencies budget time for. Use high-contrast color pairs so charts photograph and print well, annotate any sharp spike or drop directly on the chart instead of leaving it for the narrative text, and keep axis labels short enough to read at a glance on a shared screen during a client call.
Pro Tip: Test your dashboard on a phone before sending it. A surprising number of client-side stakeholders open reports on mobile between meetings, and a dashboard that only works on a widescreen monitor loses half its audience.
How Often Should Agencies Send Client Reports?
Report cadence for agencies works best as a layered system rather than a single monthly document. Different stakeholders need different rhythms, and forcing everything into one monthly PDF means either overwhelming the client with detail or under-serving the ones who want more frequent visibility.
Real-time alerts. Reserved for threshold breaches, like a campaign budget pacing 20 percent over target or a conversion rate dropping sharply. These go out automatically, not on a fixed schedule.
Weekly snapshots. A short dashboard view covering the two or three KPIs that move fastest for that client, kept to a five-minute read.
Monthly deep dives. The full report: financial and operational KPIs, campaign breakdowns, and a written narrative explaining what changed and why.
Quarterly strategy reviews. A slower, higher-altitude conversation using CLTV, retention, and margin trends to inform the next quarter’s plan.
Each cadence needs its own template skeleton. Weekly snapshots should carry no more than three charts and zero long-form commentary. Monthly reports can run to two or three pages of narrative alongside the visuals. Quarterly reviews should open with a one-page executive summary before any supporting data.
A meeting playbook keeps the monthly or quarterly call from turning into a slide read-through: send the report as a pre-read 24 hours ahead, walk in with three talking points already chosen, log every action item during the call rather than after, and assign an owner and date to each one before the meeting ends. Set a clear SLA for delivery windows and data cutoffs, such as “reports reflect data through the last business day and arrive by the 5th of the following month,” so clients know exactly when to expect numbers and stop guessing.
How an Integrated Platform Supports the Reporting Playbook
Some integrated platforms are built around the idea that reporting shouldn’t require stitching together five disconnected tools. Such platforms consolidate applicant tracking systems, sales CRMs, and contracting modules into one ecosystem, so KPIs that matter for client reporting can live in a single dataset instead of scattered spreadsheets.
That consolidation is what drives the platform’s claimed 70 percent reduction in administrative tasks, since workflows from lead contact through contract generation run on the same automated backbone. Features like contextual matching AI and OCR-based CV parsing cut the manual data entry that normally feeds into reporting errors, while Sales Reports give account teams a ready-made view of margin and revenue without a separate export step. A built-in Cloud Drive and internal team chat keep supporting documents and report context attached to the same record instead of buried in email threads.
GDPR consent management modules and full audit trails matter specifically for reporting integrity: every KPI traces back to a documented, timestamped data point, which supports the kind of client trust that automated numbers need to hold up under scrutiny.
Turning Client Feedback Into Better Reports
Client feedback on reporting almost always falls into one of three categories: too much data, not enough context, or the wrong metric entirely. Treat each differently rather than defaulting to “add more detail,” which is the instinct that got most agencies into bloated reports in the first place.
When a client says a report feels overwhelming, the fix is usually subtraction, not reorganization. Cut the report back to the core KPI set and move everything else to an appendix they can request. When a client asks “why did this number move,” that’s a signal your narrative commentary needs to be more specific, not that you need another chart. And when a client keeps asking about a metric you’re not currently tracking, that’s a request to add it to their custom KPI list, not a sign your standard template failed.
Build a lightweight intake process for report customization requests: log the request, confirm the underlying data source exists or can be connected, and set expectations on when the change takes effect (usually the next full reporting cycle, not the current one). Avoid rebuilding a client’s entire report structure on a single request. One new chart is a fair ask. A wholesale redesign after one comment usually means the original report wasn’t validated with the client before launch.
Revisit each client’s report structure formally once or twice a year, separate from ad hoc feedback, so small requests don’t accumulate into an inconsistent, hard-to-maintain template.
The Client Reporting Mistakes That Erode Trust
The most common failure in client reporting for agencies isn’t a bad metric. It’s too many metrics delivered without context, which trains clients to skim past the report entirely instead of reading it. Once a client stops opening reports, the renewal conversation gets harder, because they’ve lost the running narrative of value the report was supposed to build.
A second frequent pitfall is inconsistent KPI definitions across time periods. If “conversion rate” gets recalculated differently in March than it was in January because someone changed a formula without documenting it, the client notices the discontinuity even if they can’t articulate why the numbers feel off. Keep a single canonical formula for every KPI and version any changes so historical reports stay comparable.
A third pitfall is treating the report as the finish line instead of the start of a conversation. A report that lands in an inbox with no accompanying call or written recommendation reads as an obligation fulfilled, not a partnership maintained. Pair every report, even the automated weekly ones, with at least a short written takeaway.
Finally, agencies routinely under-invest in verifying vendor automation claims before switching tools. Ask for sample exports and audit trails during any vendor evaluation rather than trusting marketing copy, since vendor case studies report time savings that don’t always hold up once your specific data sources are connected.
Getting Staff and Clients to Actually Read the Numbers
Training on client reporting for agencies needs to happen on both sides of the relationship, because a perfectly built report still fails if nobody interprets it correctly.
Internally, new account managers should shadow at least one full reporting cycle before owning a client relationship solo, watching how a senior team member turns a KPI shift into a specific recommendation rather than a vague observation. Document your KPI formulas in an internal wiki so every account manager calculates margin or utilization the same way, and review that documentation whenever a formula changes.
On the client side, the first report for any new account should include a short walkthrough, ideally live, explaining what each KPI means and why it was chosen for their account specifically. Skipping this step is a common reason clients misread a metric or fixate on the wrong number during a review call. A one-page glossary attached to the first few reports, defining terms like utilization rate or effective hourly rate in plain language, reduces the number of “what does this mean” emails significantly.
Revisit training periodically, not just at onboarding. Client-side stakeholders change, and a new marketing director inheriting a reporting relationship benefits from the same walkthrough the original contact received.
Recruitify Team Perspective on Agency Reporting Priorities
Most agencies overcorrect in one of two directions: they either report everything and lose the client’s attention, or they report so little that renewal conversations lack evidence. The pragmatic middle is the compact KPI set built on automated, auditable data, not a bigger dashboard. Agencies that make this shift typically expect to reclaim meaningful hours per month previously spent on manual assembly, and to walk into renewal conversations with a clearer, defensible story instead of a spreadsheet nobody trusts. For agencies ready to consolidate that data pipeline instead of patching it together, an integrated platform is worth serious consideration.
- Recruitify Team
Recruitify as an Integrated Option for Reporting
Recruitify is the alternative to juggling five disconnected tools for agency reporting: one ecosystem where your ATS, CRM, and contracting data already share a single source of truth, so the KPIs in your client reports don’t require a manual reconciliation step before every send.
The platform’s Sales Reports pull margin and revenue directly from the same pipeline your recruiters work in daily, its contextual matching AI and OCR parsing cut the data entry errors that quietly corrupt reporting accuracy, and its GDPR audit trail gives clients a documented, timestamped source for every number you present. For agencies, the Recruitment Agencies plan runs €79 per month per user, and the HR Team plan runs €69 per month per user, both on the same pricing page where Enterprise pricing is available on request.
If you’re ready to stop stitching spreadsheets together, three next steps are worth taking this week: book a demo to see how the reporting data flows in practice, start a free trial to connect your own pipeline, or explore the automation features that feed directly into the KPI set this guide recommends.
Where to Verify KPI Formulas and Benchmarks
For agencies building or refining a reporting framework, a handful of sources are worth bookmarking directly. NetSuite’s KPI guide lays out the formulas and reasoning behind the 7 to 10 KPI recommendation. Pike’s profitability metrics guide breaks down operational ratios like utilization and effective hourly rate. ClicData’s automation guide walks through the connect, transform, and deliver framework in more technical depth. Databox’s white-label roundup is useful for understanding current branding expectations across reporting platforms.
Sources
Best white label reporting tools for marketing agencies | Databox
Automated Client Reporting for Marketing Agencies | ClicData
Managers are struggling to keep up with the AI productivity boom | HBR
FAQ
What Are the Best Practices for Client Reporting?
The strongest practice is limiting reports to a curated set of 7 to 10 KPIs tied directly to what the client is paying for, then automating data collection so numbers stay consistent every cycle. Pair every report with a short narrative explaining what changed and why, and keep formulas versioned so historical comparisons remain trustworthy.
What Are the Top Reporting Tools for Agencies?
Rather than naming specific vendors, evaluate any tool against seven categories: integration depth, white-labeling, automation scheduling, calculated metrics support, data governance, scalability, and pricing model. Agencies already running an integrated platform like Recruitify can pull margin and pipeline data directly from Sales Reports without adding a separate reporting tool to the stack.
What Are the Three Types of Reporting Agencies Use?
Most agencies run three layers: real-time alerts for threshold breaches, recurring dashboards (weekly or monthly) for ongoing visibility, and deeper strategic reviews (monthly or quarterly) that connect performance to business outcomes. Each layer serves a different stakeholder need and shouldn’t be collapsed into a single document.
What Makes a Good Marketing Dashboard for Agencies?
A good dashboard leads with one headline metric, ranks the top three changes since the last period, and explains why each matters before offering a recommended next step. Everything else, including channel and campaign-level detail, belongs on supporting pages a client can open if they want more depth, following the summary-first pattern that white-labeled reporting tools are increasingly built around.
How Much Does Recruitify Cost for Agency Reporting?
Recruitify’s Recruitment Agencies plan is priced at €79 per month per user, and the HR Team plan runs €69 per month per user, both listed on the pricing page. Enterprise pricing is available on request through the same page.
Recommended
News & Updates
Stay up-to-date with the latest innovations, features, and tips about Recruitify!
By providing your email address within the newsletter sign-up form, you confirm its processing to send marketing information regarding the Administrator’s products and services. The Administrator of your personal data processed for the abovementioned purposes is Recruitify Spółka z o.o., based in Warsaw, Poland (KRS 0000709889). For more information on the principles of personal data processing and the rights of data subjects, please check the Privacy Policy.

Discover More

Recruitment Process
Recruiters: Job Posting Automation, Safe Pilot and No Duplicate Posts
Guide for recruiters and agencies to implement job posting automation, get 60–90 day payback, prevent duplicate posts, and run a safe pilot.
19 Sept 2026
Discover More

Recruitment Process
For Agencies: Orchestrate Stages with Recruitment Workflow Automation
Orchestrate recruitment workflow automation with scorecards and human gates. Pilot safely; agencies report 70% fewer admin tasks.
17 Sept 2026
Discover More

HR Analytics
7 Tactics to Optimize the Recruitment Process for TA Leaders
A metrics-first playbook for TA leaders: shorten time-to-decision, improve shortlist quality, and use AI as decision support rather than a replacement.
16 Sept 2026
Discover More
Recruitment Process
Recruiters: Job Posting Automation, Safe Pilot and No Duplicate Posts
Guide for recruiters and agencies to implement job posting automation, get 60–90 day payback, prevent duplicate posts, and run a safe pilot.
19 Sept 2026
Discover More
Recruitment Process
For Agencies: Orchestrate Stages with Recruitment Workflow Automation
Orchestrate recruitment workflow automation with scorecards and human gates. Pilot safely; agencies report 70% fewer admin tasks.
17 Sept 2026
Discover More