
Last updated:
Pass EEOC's 80% Check: Diversity Recruiting Analytics for HR Teams

Applicant Tracking System

The Recruitify Team
Diversity recruiting analytics is the practice of tracking candidate data across every hiring stage to measure representation, spot bias, and test whether selection methods hold up to legal scrutiny. Done well, it lets HR teams see exactly where diverse candidates drop out of the funnel, whether a test or interview process produces adverse impact, and how outcomes move against stated targets over time. The first action for any team starting out is straightforward: instrument the funnel, capturing job_id, candidate_id, stage timestamps, and demographic data collected with consent.
TL;DR:
Tracking pass rates at each hiring stage for all demographic groups helps identify where diverse candidates drop out, not just at the final hire stage.
Consistent data collection must include job ID, stage timestamps, source, and demographic information, with proper consent, retention, and anonymization measures.
The four-fifths rule signals potential adverse impact if a protected group’s selection rate falls below 80 percent of the highest-performing group, but further validation is required.
Dashboards should focus on stage-level disparities, time-to-offer, and source performance, with automatic alerts set for impact thresholds exceeding 20 percentage points or dropping below 80 percent.
Starting with a small pilot involving two or three roles, clear KPIs, and thorough staff training enables scalable, ongoing diversity recruiting analytics programs.
RecruitifyBring Hiring Data Into One SystemRecruitify combines recruitment workflows, analytics, consent management, and anonymization to help teams organize hiring data responsibly.Explore Recruitify
Table of Contents
Core metrics and definitions to track
Data collection points and setup: what to record and where
Analytics methods and legal checks for adverse impact
Dashboards and KPIs that reveal funnel leakage and bias
DEI tech stack and integration priorities
Running an analytics-first program from pilot to scale
Evidence and practicality behind these recommendations
What surprises teams when they start measuring this
Recruitify as a practical option for analytics-ready hiring
Sources
FAQ
Core metrics and definitions to track
Diversity recruiting analytics rests on a small set of metrics, tracked consistently, rather than a large dashboard of vanity numbers. The foundation is applicant pool composition and pass rates at each stage: sift, interview, offer, and hire. Comparing these rates across demographic groups shows where a funnel leaks talent, not just whether the final hire slate looks diverse.
Time-in-stage and dropout rates by demographic group matter just as much as pass rates. A group that clears interviews at a similar rate but waits twice as long for a decision is experiencing a different process, even if the numbers at the top look fine.
Representation metrics (who applies, who advances, who gets hired) tell you what happened. Inclusion metrics (whether candidates and new hires feel respected and supported) tell you why. Relying on representation data alone misses the experience layer that ILO guidance recommends capturing through regular staff surveys covering overall inclusion, belonging, and the benefits people experience at work.
Setting baselines and targets requires patience with small numbers. A single quarter of interview data for one role rarely tells you anything reliable.
Track pass rates by stage for every demographic category you collect, not just the final hire rate.
Record time-in-stage separately from pass rate, since slow processes disproportionately affect candidates with less flexibility.
Pair every representation figure with an inclusion signal from surveys or exit interviews.
Treat any baseline built on fewer than a few dozen candidates per group as directional, not conclusive.
Data collection points and setup: what to record and where
Reliable analytics depend on a consistent schema captured at the point of action, not reconstructed later from spreadsheets. CIPD’s research found that operationalizing diversity analytics is often more about consistent data structure and governance in the applicant tracking system than about building complex statistical models.
Capture a minimal schema on every application: job_id, stage_name, candidate_id, source, timestamp, and demographic fields collected separately from the evaluation record.
Collect applicant self-identification through a voluntary, clearly worded form that explains why the data is requested and how it will and will not be used in decisions.
Store consent records with a timestamp and version of the wording shown to the candidate, so you can produce an audit trail if asked.
Set a retention period for demographic data that matches your legal basis for holding it, and delete or anonymize records once that period ends.
Link sourcing and multiposting data (which channel a candidate came from) to CRM records so the funnel view runs end to end, from first contact through offer.
Tools that support AI scoring and anonymized shortlists can help separate the evaluation record from the demographic record, which keeps recruiters focused on job-relevant criteria while still allowing later analysis. CIPD’s data shows this matters in practice: only 38% of organizations currently collect equal opportunities monitoring data from applicants at all, which means most funnels are simply invisible to this kind of analysis today.
Analytics methods and legal checks for adverse impact
Once you have stage-level data, the next question is whether any selection step is producing a disparate outcome that would not survive legal review. The EEOC’s four-fifths rule is the standard practical check: divide a protected group’s selection rate by the selection rate of the highest-performing group, and a result below 0.80 signals potential adverse impact that warrants further review.
A selection rate ratio below 80% is the EEOC’s rule-of-thumb trigger for further scrutiny of a hiring step, not a legal determination on its own. It tells you where to look, not whether you are liable.
A single hiring manager rejecting three candidates from a small pool can produce a dramatic-looking ratio that means very little. CIPD’s practitioner guidance recommends aggregating similar role families or extending the time window before calculating pass-rate ratios, and reporting confidence intervals alongside the point estimate rather than reacting to a single number.
Run the four-fifths calculation at each funnel stage separately, since impact often concentrates at one step, like the initial sift.
Aggregate data across similar roles or a longer time period when any single group has fewer than roughly 30 candidates in a stage.
If a selection procedure shows a persistent adverse impact, EEOC guidance requires it to be validated as job-related or replaced with a less discriminatory alternative.
Document the review and the decision either way, since that record is what regulators and auditors will ask for.
Dashboards and KPIs that reveal funnel leakage and bias
A dashboard earns its place only if it changes what a recruiter or hiring manager does next. The most useful widgets show the funnel broken down by demographic group at each stage, time-to-offer split by group, source performance by group, interview-panel composition, and offer acceptance rates.
Action thresholds turn a chart into a decision. A pass-rate gap wider than 20 percentage points between groups, or a four-fifths ratio that drops below the 80% line, should trigger a review rather than sit quietly in a report nobody opens.
Give recruiters a stage-level funnel view they can check weekly for the roles they are actively filling.
Give hiring managers a panel-composition and pass-rate view tied to their specific requisitions.
Give people leaders and executives a rolled-up quarterly view that tracks progress against stated targets across the whole organization.
Alert on threshold breaches automatically rather than waiting for a quarterly review to surface a pattern that started months earlier.
Pro Tip: Set alerts on the ratio itself, not just the raw numbers, so a small applicant pool doesn’t trigger false alarms.
DEI tech stack and integration priorities
Diversity analytics depends on how well your systems talk to each other, not just which tools you buy. An applicant tracking system with a structured schema is the foundation, since inconsistent field names or free-text demographic entries make every downstream report unreliable. Anonymization utilities, analytics or business intelligence connectors, and staff survey platforms round out the stack.
Integration priorities should protect two things above all: consent records and normalized fields. A consent and audit trail that timestamps every candidate interaction gives you defensible records if a decision is ever challenged, while event-level logging (not just end-of-stage snapshots) lets you see when a delay or drop-off actually happened.
Choose an ATS that enforces canonical demographic categories rather than allowing free text at the point of entry.
Prioritize integrations that preserve timestamps and outcome codes across systems, not just final status.
Use anonymization for evaluator-facing views while retaining the underlying metadata for later reporting, since full anonymization without retained metadata makes the analysis impossible to run at all.
Running an analytics-first program from pilot to scale
Start small enough to learn fast, then expand once the process holds up. Pick two or three roles or teams, instrument the funnel completely, and run a full hiring cycle before drawing conclusions.
Select a pilot scope of two to three roles with enough applicant volume to produce a meaningful baseline within one quarter.
Assign a data owner responsible for schema consistency, consent wording, and retention policy before candidates start applying.
Get legal or compliance review on the consent language and the demographic categories you plan to collect.
Train recruiters and hiring managers on why the data is collected and how it will (and will not) be used in individual decisions.
Once the pilot produces a stable baseline, template the dashboard, document the integration steps in a runbook, and roll it out to additional teams.
Pro Tip: Launch a pilot with one clear KPI, ready in roughly three months, rather than trying to instrument every role at once.
Evidence and practicality behind these recommendations
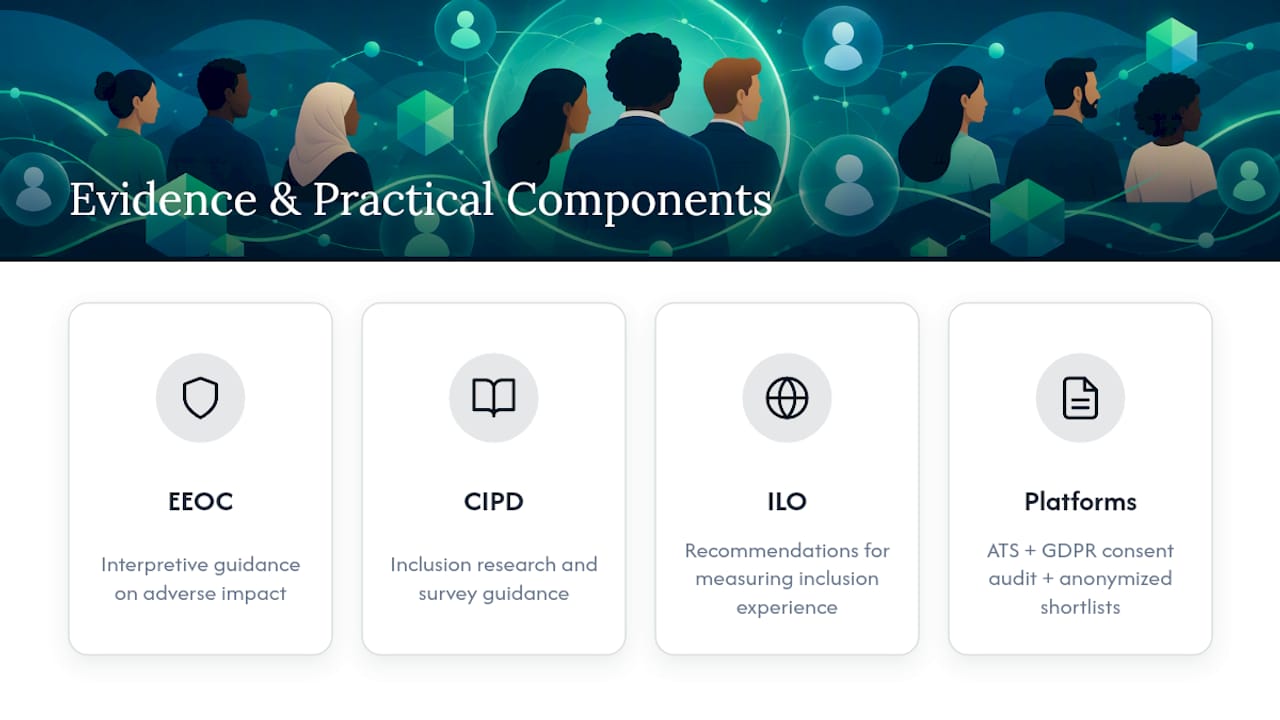
The four-fifths rule, staff survey guidance, and validation requirements referenced throughout this piece come from established bodies: the EEOC’s interpretive guidance on adverse impact, CIPD’s inclusion research, and ILO’s recommendations on measuring inclusion experience. Together they form the legal and methodological baseline behind the metrics above.
Platforms that combine structured ATS data, consent management, and anonymized candidate profiles make this kind of tracking easier to sustain in practice. A GDPR consent module with a full audit trail, paired with anonymized shortlists generated during CV parsing, addresses two of the biggest practical barriers teams run into: proving consent was collected properly and keeping evaluators focused on job-relevant criteria.
What surprises teams when they start measuring this
Most teams expect representation numbers to tell the whole story, then discover the interview stage is where diverse candidates actually drop out, not the top of the funnel. Small sample sizes routinely produce alarming-looking gaps that vanish once you aggregate a quarter or two of data. The fix isn’t more dashboards. It’s pairing the numbers with a plain follow-up question to candidates and pointing any real signal at one concrete change, like structured interview scoring or fairer scheduling windows.
- Recruitify Team
Recruitify as a practical option for analytics-ready hiring
Some platforms combine an ATS with contextual matching, CV parsing, and a GDPR consent module with a full audit trail, so the schema and consent records this article recommends are built into the workflow rather than bolted on afterward.
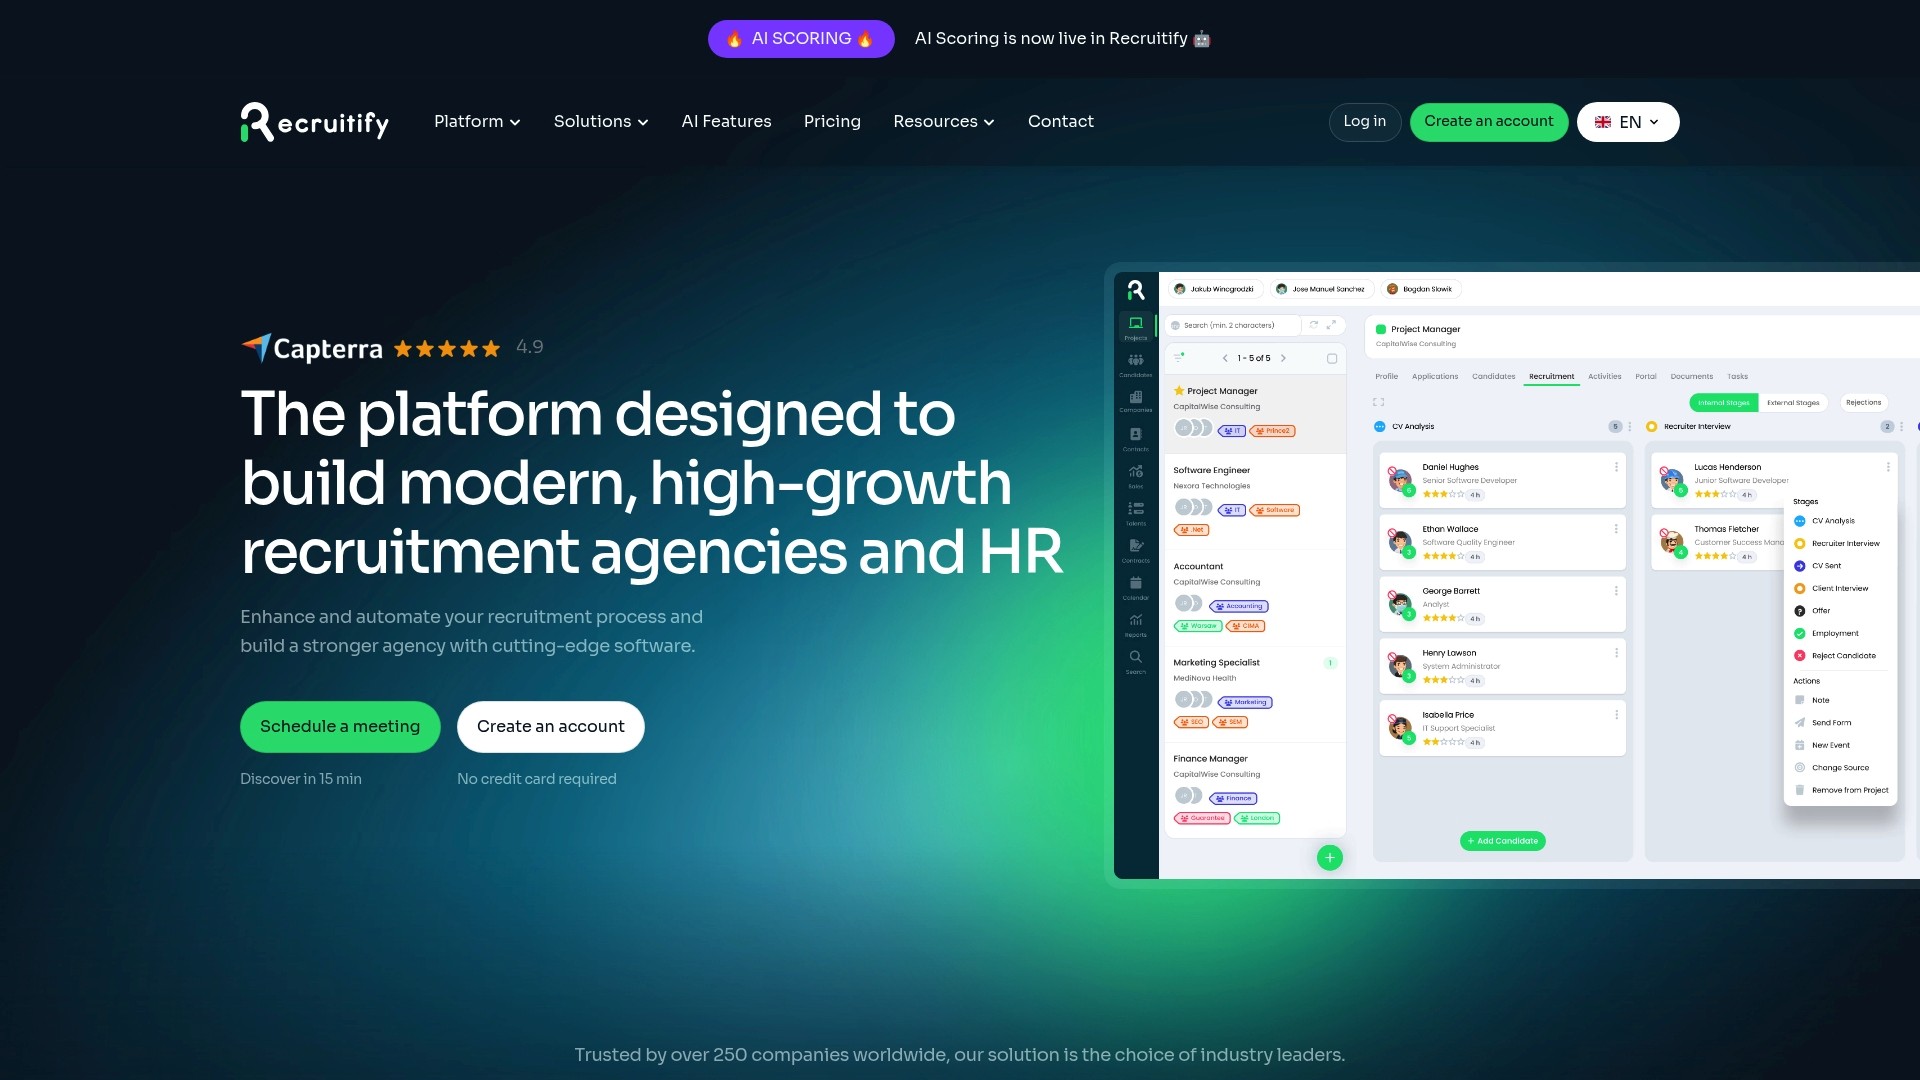
Teams that want to see how the modules fit together can review plans on the pricing page, including HR Team at 69 EUR per month per user and Recruitment Agencies at 79 EUR per month per user.
Sources
FAQ
What is diversity recruiting?
Diversity recruiting is the practice of sourcing, evaluating, and hiring candidates in a way that widens representation across the funnel while keeping selection decisions tied to job-relevant criteria. It typically pairs sourcing changes, like broader channel selection, with process changes such as structured interviews and bias-aware screening.
What is the 70/30 rule in hiring?
There is no recognized 70/30 rule in employment law or in standard HR practice. The widely used benchmark for adverse impact is the EEOC’s four-fifths rule, which flags a selection rate ratio below 0.80 between groups for further review.
What is an ATS versus a CRM in recruiting?
An applicant tracking system (ATS) manages candidates moving through a hiring funnel, from application to offer, and is where most diversity recruiting analytics data originates. A CRM manages relationships with prospects, clients, or a talent pool over time, and connecting the two gives a fuller view of sourcing performance by demographic group.
What is recruitment analytics?
Recruitment analytics is the systematic tracking of hiring funnel data, such as pass rates, time-in-stage, and source performance, to identify friction points and measure progress against hiring goals. When it includes demographic breakdowns and adverse impact checks like the four-fifths rule, it becomes diversity recruiting analytics specifically.
How do you analyze recruiting diversity without misleading results?
Analyze stage-by-stage pass rates by demographic group rather than relying on the final hire rate alone, and aggregate data across roles or time periods when any group’s sample is small. Pairing quantitative funnel data with periodic staff surveys, as ILO guidance recommends, adds context that raw numbers alone cannot provide.
Recommended


News & Updates
Stay up-to-date with the latest innovations, features, and tips about Recruitify!
By providing your email address within the newsletter sign-up form, you confirm its processing to send marketing information regarding the Administrator’s products and services. The Administrator of your personal data processed for the abovementioned purposes is Recruitify Spółka z o.o., based in Warsaw, Poland (KRS 0000709889). For more information on the principles of personal data processing and the rights of data subjects, please check the Privacy Policy.

Last updated:
Pass EEOC's 80% Check: Diversity Recruiting Analytics for HR Teams
Applicant Tracking System
The Recruitify Team
Diversity recruiting analytics is the practice of tracking candidate data across every hiring stage to measure representation, spot bias, and test whether selection methods hold up to legal scrutiny. Done well, it lets HR teams see exactly where diverse candidates drop out of the funnel, whether a test or interview process produces adverse impact, and how outcomes move against stated targets over time. The first action for any team starting out is straightforward: instrument the funnel, capturing job_id, candidate_id, stage timestamps, and demographic data collected with consent.
TL;DR:
Tracking pass rates at each hiring stage for all demographic groups helps identify where diverse candidates drop out, not just at the final hire stage.
Consistent data collection must include job ID, stage timestamps, source, and demographic information, with proper consent, retention, and anonymization measures.
The four-fifths rule signals potential adverse impact if a protected group’s selection rate falls below 80 percent of the highest-performing group, but further validation is required.
Dashboards should focus on stage-level disparities, time-to-offer, and source performance, with automatic alerts set for impact thresholds exceeding 20 percentage points or dropping below 80 percent.
Starting with a small pilot involving two or three roles, clear KPIs, and thorough staff training enables scalable, ongoing diversity recruiting analytics programs.
RecruitifyBring Hiring Data Into One SystemRecruitify combines recruitment workflows, analytics, consent management, and anonymization to help teams organize hiring data responsibly.Explore Recruitify
Table of Contents
Core metrics and definitions to track
Data collection points and setup: what to record and where
Analytics methods and legal checks for adverse impact
Dashboards and KPIs that reveal funnel leakage and bias
DEI tech stack and integration priorities
Running an analytics-first program from pilot to scale
Evidence and practicality behind these recommendations
What surprises teams when they start measuring this
Recruitify as a practical option for analytics-ready hiring
Sources
FAQ
Core metrics and definitions to track
Diversity recruiting analytics rests on a small set of metrics, tracked consistently, rather than a large dashboard of vanity numbers. The foundation is applicant pool composition and pass rates at each stage: sift, interview, offer, and hire. Comparing these rates across demographic groups shows where a funnel leaks talent, not just whether the final hire slate looks diverse.
Time-in-stage and dropout rates by demographic group matter just as much as pass rates. A group that clears interviews at a similar rate but waits twice as long for a decision is experiencing a different process, even if the numbers at the top look fine.
Representation metrics (who applies, who advances, who gets hired) tell you what happened. Inclusion metrics (whether candidates and new hires feel respected and supported) tell you why. Relying on representation data alone misses the experience layer that ILO guidance recommends capturing through regular staff surveys covering overall inclusion, belonging, and the benefits people experience at work.
Setting baselines and targets requires patience with small numbers. A single quarter of interview data for one role rarely tells you anything reliable.
Track pass rates by stage for every demographic category you collect, not just the final hire rate.
Record time-in-stage separately from pass rate, since slow processes disproportionately affect candidates with less flexibility.
Pair every representation figure with an inclusion signal from surveys or exit interviews.
Treat any baseline built on fewer than a few dozen candidates per group as directional, not conclusive.
Data collection points and setup: what to record and where
Reliable analytics depend on a consistent schema captured at the point of action, not reconstructed later from spreadsheets. CIPD’s research found that operationalizing diversity analytics is often more about consistent data structure and governance in the applicant tracking system than about building complex statistical models.
Capture a minimal schema on every application: job_id, stage_name, candidate_id, source, timestamp, and demographic fields collected separately from the evaluation record.
Collect applicant self-identification through a voluntary, clearly worded form that explains why the data is requested and how it will and will not be used in decisions.
Store consent records with a timestamp and version of the wording shown to the candidate, so you can produce an audit trail if asked.
Set a retention period for demographic data that matches your legal basis for holding it, and delete or anonymize records once that period ends.
Link sourcing and multiposting data (which channel a candidate came from) to CRM records so the funnel view runs end to end, from first contact through offer.
Tools that support AI scoring and anonymized shortlists can help separate the evaluation record from the demographic record, which keeps recruiters focused on job-relevant criteria while still allowing later analysis. CIPD’s data shows this matters in practice: only 38% of organizations currently collect equal opportunities monitoring data from applicants at all, which means most funnels are simply invisible to this kind of analysis today.
Analytics methods and legal checks for adverse impact
Once you have stage-level data, the next question is whether any selection step is producing a disparate outcome that would not survive legal review. The EEOC’s four-fifths rule is the standard practical check: divide a protected group’s selection rate by the selection rate of the highest-performing group, and a result below 0.80 signals potential adverse impact that warrants further review.
A selection rate ratio below 80% is the EEOC’s rule-of-thumb trigger for further scrutiny of a hiring step, not a legal determination on its own. It tells you where to look, not whether you are liable.
A single hiring manager rejecting three candidates from a small pool can produce a dramatic-looking ratio that means very little. CIPD’s practitioner guidance recommends aggregating similar role families or extending the time window before calculating pass-rate ratios, and reporting confidence intervals alongside the point estimate rather than reacting to a single number.
Run the four-fifths calculation at each funnel stage separately, since impact often concentrates at one step, like the initial sift.
Aggregate data across similar roles or a longer time period when any single group has fewer than roughly 30 candidates in a stage.
If a selection procedure shows a persistent adverse impact, EEOC guidance requires it to be validated as job-related or replaced with a less discriminatory alternative.
Document the review and the decision either way, since that record is what regulators and auditors will ask for.
Dashboards and KPIs that reveal funnel leakage and bias
A dashboard earns its place only if it changes what a recruiter or hiring manager does next. The most useful widgets show the funnel broken down by demographic group at each stage, time-to-offer split by group, source performance by group, interview-panel composition, and offer acceptance rates.
Action thresholds turn a chart into a decision. A pass-rate gap wider than 20 percentage points between groups, or a four-fifths ratio that drops below the 80% line, should trigger a review rather than sit quietly in a report nobody opens.
Give recruiters a stage-level funnel view they can check weekly for the roles they are actively filling.
Give hiring managers a panel-composition and pass-rate view tied to their specific requisitions.
Give people leaders and executives a rolled-up quarterly view that tracks progress against stated targets across the whole organization.
Alert on threshold breaches automatically rather than waiting for a quarterly review to surface a pattern that started months earlier.
Pro Tip: Set alerts on the ratio itself, not just the raw numbers, so a small applicant pool doesn’t trigger false alarms.
DEI tech stack and integration priorities
Diversity analytics depends on how well your systems talk to each other, not just which tools you buy. An applicant tracking system with a structured schema is the foundation, since inconsistent field names or free-text demographic entries make every downstream report unreliable. Anonymization utilities, analytics or business intelligence connectors, and staff survey platforms round out the stack.
Integration priorities should protect two things above all: consent records and normalized fields. A consent and audit trail that timestamps every candidate interaction gives you defensible records if a decision is ever challenged, while event-level logging (not just end-of-stage snapshots) lets you see when a delay or drop-off actually happened.
Choose an ATS that enforces canonical demographic categories rather than allowing free text at the point of entry.
Prioritize integrations that preserve timestamps and outcome codes across systems, not just final status.
Use anonymization for evaluator-facing views while retaining the underlying metadata for later reporting, since full anonymization without retained metadata makes the analysis impossible to run at all.
Running an analytics-first program from pilot to scale
Start small enough to learn fast, then expand once the process holds up. Pick two or three roles or teams, instrument the funnel completely, and run a full hiring cycle before drawing conclusions.
Select a pilot scope of two to three roles with enough applicant volume to produce a meaningful baseline within one quarter.
Assign a data owner responsible for schema consistency, consent wording, and retention policy before candidates start applying.
Get legal or compliance review on the consent language and the demographic categories you plan to collect.
Train recruiters and hiring managers on why the data is collected and how it will (and will not) be used in individual decisions.
Once the pilot produces a stable baseline, template the dashboard, document the integration steps in a runbook, and roll it out to additional teams.
Pro Tip: Launch a pilot with one clear KPI, ready in roughly three months, rather than trying to instrument every role at once.
Evidence and practicality behind these recommendations
The four-fifths rule, staff survey guidance, and validation requirements referenced throughout this piece come from established bodies: the EEOC’s interpretive guidance on adverse impact, CIPD’s inclusion research, and ILO’s recommendations on measuring inclusion experience. Together they form the legal and methodological baseline behind the metrics above.
Platforms that combine structured ATS data, consent management, and anonymized candidate profiles make this kind of tracking easier to sustain in practice. A GDPR consent module with a full audit trail, paired with anonymized shortlists generated during CV parsing, addresses two of the biggest practical barriers teams run into: proving consent was collected properly and keeping evaluators focused on job-relevant criteria.
What surprises teams when they start measuring this
Most teams expect representation numbers to tell the whole story, then discover the interview stage is where diverse candidates actually drop out, not the top of the funnel. Small sample sizes routinely produce alarming-looking gaps that vanish once you aggregate a quarter or two of data. The fix isn’t more dashboards. It’s pairing the numbers with a plain follow-up question to candidates and pointing any real signal at one concrete change, like structured interview scoring or fairer scheduling windows.
- Recruitify Team
Recruitify as a practical option for analytics-ready hiring
Some platforms combine an ATS with contextual matching, CV parsing, and a GDPR consent module with a full audit trail, so the schema and consent records this article recommends are built into the workflow rather than bolted on afterward.
Teams that want to see how the modules fit together can review plans on the pricing page, including HR Team at 69 EUR per month per user and Recruitment Agencies at 79 EUR per month per user.
Sources
FAQ
What is diversity recruiting?
Diversity recruiting is the practice of sourcing, evaluating, and hiring candidates in a way that widens representation across the funnel while keeping selection decisions tied to job-relevant criteria. It typically pairs sourcing changes, like broader channel selection, with process changes such as structured interviews and bias-aware screening.
What is the 70/30 rule in hiring?
There is no recognized 70/30 rule in employment law or in standard HR practice. The widely used benchmark for adverse impact is the EEOC’s four-fifths rule, which flags a selection rate ratio below 0.80 between groups for further review.
What is an ATS versus a CRM in recruiting?
An applicant tracking system (ATS) manages candidates moving through a hiring funnel, from application to offer, and is where most diversity recruiting analytics data originates. A CRM manages relationships with prospects, clients, or a talent pool over time, and connecting the two gives a fuller view of sourcing performance by demographic group.
What is recruitment analytics?
Recruitment analytics is the systematic tracking of hiring funnel data, such as pass rates, time-in-stage, and source performance, to identify friction points and measure progress against hiring goals. When it includes demographic breakdowns and adverse impact checks like the four-fifths rule, it becomes diversity recruiting analytics specifically.
How do you analyze recruiting diversity without misleading results?
Analyze stage-by-stage pass rates by demographic group rather than relying on the final hire rate alone, and aggregate data across roles or time periods when any group’s sample is small. Pairing quantitative funnel data with periodic staff surveys, as ILO guidance recommends, adds context that raw numbers alone cannot provide.
Recommended
News & Updates
Stay up-to-date with the latest innovations, features, and tips about Recruitify!
By providing your email address within the newsletter sign-up form, you confirm its processing to send marketing information regarding the Administrator’s products and services. The Administrator of your personal data processed for the abovementioned purposes is Recruitify Spółka z o.o., based in Warsaw, Poland (KRS 0000709889). For more information on the principles of personal data processing and the rights of data subjects, please check the Privacy Policy.
Last updated:
Pass EEOC's 80% Check: Diversity Recruiting Analytics for HR Teams
Applicant Tracking System
The Recruitify Team
Diversity recruiting analytics is the practice of tracking candidate data across every hiring stage to measure representation, spot bias, and test whether selection methods hold up to legal scrutiny. Done well, it lets HR teams see exactly where diverse candidates drop out of the funnel, whether a test or interview process produces adverse impact, and how outcomes move against stated targets over time. The first action for any team starting out is straightforward: instrument the funnel, capturing job_id, candidate_id, stage timestamps, and demographic data collected with consent.
TL;DR:
Tracking pass rates at each hiring stage for all demographic groups helps identify where diverse candidates drop out, not just at the final hire stage.
Consistent data collection must include job ID, stage timestamps, source, and demographic information, with proper consent, retention, and anonymization measures.
The four-fifths rule signals potential adverse impact if a protected group’s selection rate falls below 80 percent of the highest-performing group, but further validation is required.
Dashboards should focus on stage-level disparities, time-to-offer, and source performance, with automatic alerts set for impact thresholds exceeding 20 percentage points or dropping below 80 percent.
Starting with a small pilot involving two or three roles, clear KPIs, and thorough staff training enables scalable, ongoing diversity recruiting analytics programs.
RecruitifyBring Hiring Data Into One SystemRecruitify combines recruitment workflows, analytics, consent management, and anonymization to help teams organize hiring data responsibly.Explore Recruitify
Table of Contents
Core metrics and definitions to track
Data collection points and setup: what to record and where
Analytics methods and legal checks for adverse impact
Dashboards and KPIs that reveal funnel leakage and bias
DEI tech stack and integration priorities
Running an analytics-first program from pilot to scale
Evidence and practicality behind these recommendations
What surprises teams when they start measuring this
Recruitify as a practical option for analytics-ready hiring
Sources
FAQ
Core metrics and definitions to track
Diversity recruiting analytics rests on a small set of metrics, tracked consistently, rather than a large dashboard of vanity numbers. The foundation is applicant pool composition and pass rates at each stage: sift, interview, offer, and hire. Comparing these rates across demographic groups shows where a funnel leaks talent, not just whether the final hire slate looks diverse.
Time-in-stage and dropout rates by demographic group matter just as much as pass rates. A group that clears interviews at a similar rate but waits twice as long for a decision is experiencing a different process, even if the numbers at the top look fine.
Representation metrics (who applies, who advances, who gets hired) tell you what happened. Inclusion metrics (whether candidates and new hires feel respected and supported) tell you why. Relying on representation data alone misses the experience layer that ILO guidance recommends capturing through regular staff surveys covering overall inclusion, belonging, and the benefits people experience at work.
Setting baselines and targets requires patience with small numbers. A single quarter of interview data for one role rarely tells you anything reliable.
Track pass rates by stage for every demographic category you collect, not just the final hire rate.
Record time-in-stage separately from pass rate, since slow processes disproportionately affect candidates with less flexibility.
Pair every representation figure with an inclusion signal from surveys or exit interviews.
Treat any baseline built on fewer than a few dozen candidates per group as directional, not conclusive.
Data collection points and setup: what to record and where
Reliable analytics depend on a consistent schema captured at the point of action, not reconstructed later from spreadsheets. CIPD’s research found that operationalizing diversity analytics is often more about consistent data structure and governance in the applicant tracking system than about building complex statistical models.
Capture a minimal schema on every application: job_id, stage_name, candidate_id, source, timestamp, and demographic fields collected separately from the evaluation record.
Collect applicant self-identification through a voluntary, clearly worded form that explains why the data is requested and how it will and will not be used in decisions.
Store consent records with a timestamp and version of the wording shown to the candidate, so you can produce an audit trail if asked.
Set a retention period for demographic data that matches your legal basis for holding it, and delete or anonymize records once that period ends.
Link sourcing and multiposting data (which channel a candidate came from) to CRM records so the funnel view runs end to end, from first contact through offer.
Tools that support AI scoring and anonymized shortlists can help separate the evaluation record from the demographic record, which keeps recruiters focused on job-relevant criteria while still allowing later analysis. CIPD’s data shows this matters in practice: only 38% of organizations currently collect equal opportunities monitoring data from applicants at all, which means most funnels are simply invisible to this kind of analysis today.
Analytics methods and legal checks for adverse impact
Once you have stage-level data, the next question is whether any selection step is producing a disparate outcome that would not survive legal review. The EEOC’s four-fifths rule is the standard practical check: divide a protected group’s selection rate by the selection rate of the highest-performing group, and a result below 0.80 signals potential adverse impact that warrants further review.
A selection rate ratio below 80% is the EEOC’s rule-of-thumb trigger for further scrutiny of a hiring step, not a legal determination on its own. It tells you where to look, not whether you are liable.
A single hiring manager rejecting three candidates from a small pool can produce a dramatic-looking ratio that means very little. CIPD’s practitioner guidance recommends aggregating similar role families or extending the time window before calculating pass-rate ratios, and reporting confidence intervals alongside the point estimate rather than reacting to a single number.
Run the four-fifths calculation at each funnel stage separately, since impact often concentrates at one step, like the initial sift.
Aggregate data across similar roles or a longer time period when any single group has fewer than roughly 30 candidates in a stage.
If a selection procedure shows a persistent adverse impact, EEOC guidance requires it to be validated as job-related or replaced with a less discriminatory alternative.
Document the review and the decision either way, since that record is what regulators and auditors will ask for.
Dashboards and KPIs that reveal funnel leakage and bias
A dashboard earns its place only if it changes what a recruiter or hiring manager does next. The most useful widgets show the funnel broken down by demographic group at each stage, time-to-offer split by group, source performance by group, interview-panel composition, and offer acceptance rates.
Action thresholds turn a chart into a decision. A pass-rate gap wider than 20 percentage points between groups, or a four-fifths ratio that drops below the 80% line, should trigger a review rather than sit quietly in a report nobody opens.
Give recruiters a stage-level funnel view they can check weekly for the roles they are actively filling.
Give hiring managers a panel-composition and pass-rate view tied to their specific requisitions.
Give people leaders and executives a rolled-up quarterly view that tracks progress against stated targets across the whole organization.
Alert on threshold breaches automatically rather than waiting for a quarterly review to surface a pattern that started months earlier.
Pro Tip: Set alerts on the ratio itself, not just the raw numbers, so a small applicant pool doesn’t trigger false alarms.
DEI tech stack and integration priorities
Diversity analytics depends on how well your systems talk to each other, not just which tools you buy. An applicant tracking system with a structured schema is the foundation, since inconsistent field names or free-text demographic entries make every downstream report unreliable. Anonymization utilities, analytics or business intelligence connectors, and staff survey platforms round out the stack.
Integration priorities should protect two things above all: consent records and normalized fields. A consent and audit trail that timestamps every candidate interaction gives you defensible records if a decision is ever challenged, while event-level logging (not just end-of-stage snapshots) lets you see when a delay or drop-off actually happened.
Choose an ATS that enforces canonical demographic categories rather than allowing free text at the point of entry.
Prioritize integrations that preserve timestamps and outcome codes across systems, not just final status.
Use anonymization for evaluator-facing views while retaining the underlying metadata for later reporting, since full anonymization without retained metadata makes the analysis impossible to run at all.
Running an analytics-first program from pilot to scale
Start small enough to learn fast, then expand once the process holds up. Pick two or three roles or teams, instrument the funnel completely, and run a full hiring cycle before drawing conclusions.
Select a pilot scope of two to three roles with enough applicant volume to produce a meaningful baseline within one quarter.
Assign a data owner responsible for schema consistency, consent wording, and retention policy before candidates start applying.
Get legal or compliance review on the consent language and the demographic categories you plan to collect.
Train recruiters and hiring managers on why the data is collected and how it will (and will not) be used in individual decisions.
Once the pilot produces a stable baseline, template the dashboard, document the integration steps in a runbook, and roll it out to additional teams.
Pro Tip: Launch a pilot with one clear KPI, ready in roughly three months, rather than trying to instrument every role at once.
Evidence and practicality behind these recommendations
The four-fifths rule, staff survey guidance, and validation requirements referenced throughout this piece come from established bodies: the EEOC’s interpretive guidance on adverse impact, CIPD’s inclusion research, and ILO’s recommendations on measuring inclusion experience. Together they form the legal and methodological baseline behind the metrics above.
Platforms that combine structured ATS data, consent management, and anonymized candidate profiles make this kind of tracking easier to sustain in practice. A GDPR consent module with a full audit trail, paired with anonymized shortlists generated during CV parsing, addresses two of the biggest practical barriers teams run into: proving consent was collected properly and keeping evaluators focused on job-relevant criteria.
What surprises teams when they start measuring this
Most teams expect representation numbers to tell the whole story, then discover the interview stage is where diverse candidates actually drop out, not the top of the funnel. Small sample sizes routinely produce alarming-looking gaps that vanish once you aggregate a quarter or two of data. The fix isn’t more dashboards. It’s pairing the numbers with a plain follow-up question to candidates and pointing any real signal at one concrete change, like structured interview scoring or fairer scheduling windows.
- Recruitify Team
Recruitify as a practical option for analytics-ready hiring
Some platforms combine an ATS with contextual matching, CV parsing, and a GDPR consent module with a full audit trail, so the schema and consent records this article recommends are built into the workflow rather than bolted on afterward.
Teams that want to see how the modules fit together can review plans on the pricing page, including HR Team at 69 EUR per month per user and Recruitment Agencies at 79 EUR per month per user.
Sources
FAQ
What is diversity recruiting?
Diversity recruiting is the practice of sourcing, evaluating, and hiring candidates in a way that widens representation across the funnel while keeping selection decisions tied to job-relevant criteria. It typically pairs sourcing changes, like broader channel selection, with process changes such as structured interviews and bias-aware screening.
What is the 70/30 rule in hiring?
There is no recognized 70/30 rule in employment law or in standard HR practice. The widely used benchmark for adverse impact is the EEOC’s four-fifths rule, which flags a selection rate ratio below 0.80 between groups for further review.
What is an ATS versus a CRM in recruiting?
An applicant tracking system (ATS) manages candidates moving through a hiring funnel, from application to offer, and is where most diversity recruiting analytics data originates. A CRM manages relationships with prospects, clients, or a talent pool over time, and connecting the two gives a fuller view of sourcing performance by demographic group.
What is recruitment analytics?
Recruitment analytics is the systematic tracking of hiring funnel data, such as pass rates, time-in-stage, and source performance, to identify friction points and measure progress against hiring goals. When it includes demographic breakdowns and adverse impact checks like the four-fifths rule, it becomes diversity recruiting analytics specifically.
How do you analyze recruiting diversity without misleading results?
Analyze stage-by-stage pass rates by demographic group rather than relying on the final hire rate alone, and aggregate data across roles or time periods when any group’s sample is small. Pairing quantitative funnel data with periodic staff surveys, as ILO guidance recommends, adds context that raw numbers alone cannot provide.
Recommended
News & Updates
Stay up-to-date with the latest innovations, features, and tips about Recruitify!
By providing your email address within the newsletter sign-up form, you confirm its processing to send marketing information regarding the Administrator’s products and services. The Administrator of your personal data processed for the abovementioned purposes is Recruitify Spółka z o.o., based in Warsaw, Poland (KRS 0000709889). For more information on the principles of personal data processing and the rights of data subjects, please check the Privacy Policy.

Discover More

Applicant Tracking System
HR Teams: Build Recruitment Dashboards Fast With 3–5 KPIs
HR teams: design recruitment dashboards that drive decisions. Pick 3–5 KPIs, map each to the hiring decision it should trigger, and build fast.
28 Sept 2026
Discover More

Applicant Tracking System
Cut Screening Time 70%: Six Phase Remote Hiring Process for HR Teams
Redesign your remote hiring process with an async first six phase workflow, practical templates, and automation that can cut screening time 70%.
27 Sept 2026
Discover More

Applicant Tracking System
Prove Channel ROI in 90 Days, Recruiters Using Source of Hire Tracking
Practical playbook for recruiters to enforce ATS tagging, attribution rules, and dashboards tying source of hire to cost, time to hire, and 12 month...
26 Sept 2026
Discover More
Applicant Tracking System
HR Teams: Build Recruitment Dashboards Fast With 3–5 KPIs
HR teams: design recruitment dashboards that drive decisions. Pick 3–5 KPIs, map each to the hiring decision it should trigger, and build fast.
28 Sept 2026
Discover More
Applicant Tracking System
Cut Screening Time 70%: Six Phase Remote Hiring Process for HR Teams
Redesign your remote hiring process with an async first six phase workflow, practical templates, and automation that can cut screening time 70%.
27 Sept 2026
Discover More