Last updated:
Recruiter Productivity Metrics: 3 Measures That Expose Funnel Leaks

Recruitment Process

The Recruitify Team
Track requisitions per recruiter, submittal-to-interview ratio, interviews per hire, time-to-hire by stage, a composite quality of hire, cost per hire, offer acceptance rate, early turnover, and candidate experience score. Outcomes such as quality and retention outweigh raw activity counts, a pattern SHRM and CIPD research both point toward. Recruitify supports recruitment analytics.
RecruitifySee Your Recruitment Funnel More ClearlyRecruitify brings ATS, sales CRM, and IT contracting data together, helping recruitment agencies reduce scattered information and track performance.Explore Recruitify
Key Takeaways
Organizations that focus on outcome-based recruitment metrics like quality of hire and early turnover outperform those that only track activity levels.
Point | Details |
|---|---|
Use stage-level timing | Measure time spent at each recruitment stage to identify bottlenecks and target improvements effectively. |
Prioritize outcome metrics | Track quality of hire, early turnover, and offer acceptance rate to assess real recruitment success. |
Automate data collection | Leverage recruiting platforms like Recruitify to automatically gather and analyze key performance indicators. |
Implement a pilot program | Select specific roles to measure success, refine your process, and build a goal-oriented recruitment culture. |
Align sales and recruiting efforts | Connect CRM and ATS data to optimize requisition flow, client relationships, and hiring outcomes. |
Table of Contents
Which recruiter productivity metrics belong on your dashboard today?
Speed metrics: time-to-hire, time-to-fill, and stage-level breakdown
Quality metrics: building a usable quality-of-hire composite
Productivity metrics: requisitions per recruiter, submittal-to-interview ratios, and placements
Cost metrics: calculating cost per hire alongside quality and speed
Candidate experience metrics: completion rate, drop-off, and candidate NPS
Turning metrics into practice: a Talent Architect pilot plan
Recruiter activity metrics: calls made, emails sent, interviews scheduled
Pipeline velocity and funnel conversion rates through different stages
Recruitment marketing metrics and employer branding impact
Integrating sales CRM and recruiting metrics for a holistic performance view
Why we measure outcomes over activity
How Recruitify helps you automate metrics, dashboards, and AI scoring
FAQ
Sources
Which recruiter productivity metrics belong on your dashboard today?
Start with a short list you can copy into a measurement template. Each metric below carries a definition, a formula, a data source, a type (outcome or activity) and a review cadence.
Requisitions per recruiter (activity, monthly): open requisitions divided by active recruiters. Source: ATS.
Submittal-to-interview ratio (outcome, weekly): candidates interviewed divided by candidates submitted. Source: ATS.
Interviews per hire (outcome, monthly): total interviews held divided by hires made. Source: ATS and calendar data.
Time-to-hire and time per stage (outcome, weekly): days from application or first contact to accepted offer, split by stage. Source: ATS timestamps.
Quality of hire (outcome, quarterly): a weighted composite of performance, retention, manager satisfaction and ramp time. Source: HRIS and manager surveys.
Cost per hire (outcome, quarterly): total recruiting spend divided by hires. Source: finance and ATS.
Offer acceptance rate (outcome, monthly): offers accepted divided by offers extended. Source: ATS.
Early turnover (outcome, quarterly): new hires who leave within 6 or 12 months divided by hires in that cohort. Source: HRIS.
Candidate experience score (outcome, monthly): average rating or NPS from candidate surveys. Source: survey tool.
If you only have an hour this week, start three: time per stage, offer acceptance rate and submittal-to-interview ratio. All three come straight from ATS data you already hold, and together they show where your funnel leaks.
Speed metrics: time-to-hire, time-to-fill, and stage-level breakdown
Two terms get blended constantly. Time-to-hire counts the days from a candidate’s application (or first contact) to their accepted offer. Time-to-fill counts the days from the requisition opening to the accepted offer. Time-to-fill reflects how fast the business moves, including approvals. Time-to-hire reflects how fast your process moves once a candidate is in it.
A single blended number hides the real problem. A long average might mean sourcing is slow, or it might mean managers take too long to schedule interviews. Stage-level measurement tells you which, and it tells you whose problem it is.
Measure these five stages:
Sourcing: days from requisition open to first qualified applicant or contact.
Time-to-screen: days from application to completed recruiter screen.
Time-to-schedule: days from screen to the first scheduled interview.
Time-to-offer: days from final interview to offer extended.
Time-to-start: days from offer acceptance to the first day of work.
Take an illustrative example. A candidate applies, is screened, interviewed, receives an offer and accepts. The stage view can reveal how long scheduling took, which helps show where to look first. If the requisition opened before the applicant arrived, time-to-fill would be longer than time-to-hire.
Automation changes specific stages, not the whole line. Resume parsing and AI scoring should shorten time-to-screen. Self-scheduling should shorten time-to-schedule. If time-to-offer does not move after you automate screening, the bottleneck sits in manager decisions or approvals, and a tool will not fix it. Our guide on cutting time-to-hire walks through stage-level examples in more detail.
Review stage times weekly, because flow problems compound fast. Compare medians rather than averages, since one stalled requisition can distort a mean badly.
Pro Tip: Report the median for each stage to show your typical experience, and review unusually long cases to see where delays occur.
Quality metrics: building a usable quality-of-hire composite
Quality of hire is the metric most leaders call the most important, yet few organizations have a standardized formula for it. The practical fix is a composite that blends four signals available inside most HR systems.
Performance rating: the new hire’s most recent review score, normalized to a consistent scale.
Retention: whether the hire is still employed at the checkpoint (100 if yes, 0 if no).
Hiring manager satisfaction: a short manager survey score, normalized to a consistent scale.
Time-to-productivity: how quickly the hire reached the expected output, scored against a role-specific target.
A simple weighted formula combines performance, retention, manager satisfaction and time-to-productivity. Choose and document weights that suit your needs, since there is no single standard. Tune them to the role: for a sales role, you might raise time-to-productivity, and for a leadership role, you might raise manager satisfaction.
Run the measurement twice. A 6-month check catches early problems in fit and onboarding and lets you refine the assessment process. A 12-month check gives the fuller composite, once performance ratings and retention have had time to mean something. SHRM’s analysis describes top teams measuring at 12 months with a composite built on exactly these inputs, with 6-month checks used to adjust.
SHRM finds that Talent Architects, the most effective recruitment teams, measure quality of hire almost twice as often as average teams. Measurement discipline, not extra headcount, is what separates them.
Capture these fields in a simple spreadsheet or your ATS so the data exists when you need it:
Hire ID, role, recruiter, source channel and start date
Hiring manager name and the sourcing channel that produced the hire
6-month and 12-month performance rating
Still employed at 6 months and at 12 months (yes or no)
Manager satisfaction score at 6 and 12 months
Days to reach target productivity
Feed the results back into sourcing decisions. If hires from one channel score well below hires from another, move budget. If one hiring manager’s hires leave early more often, that is a conversation about the role and the manager, not only about the recruiter. For a worked pilot, see our post on automating quality-of-hire KPIs.
Productivity metrics: requisitions per recruiter, submittal-to-interview ratios, and placements
Requisitions per recruiter tells you workload. It does not tell you effectiveness. SHRM’s 2026 benchmarking reports that extra-large organizations saw a 67% increase in requisitions per recruiter in 2026, which shows how quickly load can climb without anyone deciding it should. A raw count also misleads: ten requisitions for warehouse roles are not equal to ten for senior engineers. Use a weighted measure that assigns higher points to hard-to-fill or senior roles.
The two ratios that reflect recruiter judgment are these:
Submittal-to-interview ratio = candidates interviewed / candidates submitted to the hiring manager. A low ratio means you send weak matches or the manager’s criteria are unclear.
Interview-to-offer ratio = offers extended / candidates interviewed. A low ratio points to misaligned expectations, a weak interview process, or a manager who cannot decide.
Interpretation matters more than the number. The number could signal poor screening, or it could signal that the manager changed the brief mid-search. Read the ratio alongside the manager’s feedback before drawing conclusions about the recruiter.
Use these metrics at the team and process level. Raw individual scorecards invite gaming: recruiters submit fewer, safer candidates to inflate ratios, or rush hires to pad placement counts. Healthy governance includes:
Adjusting for role complexity and market conditions before comparing people
Setting targets for teams, not individuals
Pairing every volume metric with an outcome metric such as early turnover
Reviewing outliers in a conversation, never as an automatic verdict
Pro Tip: If a recruiter’s ratios look unusual, check the requisition mix before the person. Role types can help explain differences in the results.
Cost metrics: calculating cost per hire alongside quality and speed
Cost per hire is simple to state and easy to get wrong. Use this sequence:
Add external costs: job advertising, agency fees, assessment tools, background checks, relocation, and sourcing subscriptions.
Add internal costs: recruiter and coordinator time (salary share), hiring manager interview time if you track it, referral bonuses, and recruiting software.
Add them together for the period.
Divide by the number of hires in the same period.
Be explicit about exclusions, such as onboarding and training costs or general HR overhead, and keep that definition fixed. A metric whose boundaries drift from quarter to quarter cannot be trended.
SHRM’s 2026 benchmarking draws on data from over 4,600 organizations and tracks cost per hire and time-to-fill trends across organization sizes. Use it to see where your figures sit relative to peers of your size.
Watch out for the trap of optimizing cost alone. Cutting spend lowers cost per hire, but it can also raise early turnover, which pushes the real price of each hire up. A cheap hire who leaves in five months is the most expensive outcome on your dashboard. Always read cost beside quality of hire and early turnover.
Awareness of return on investment is thin as well: CIPD’s resourcing and talent planning survey found that only 19% of organizations measure recruitment ROI. If you track cost against quality, you are ahead of most. Our piece on maximizing ROI from recruitment software covers how to attach savings to specific process changes.
Candidate experience metrics: completion rate, drop-off, and candidate NPS
Candidate experience is a measurable input, and it may relate to retention. CIPD research reports a positive link between candidate experience and the likelihood of a new hire staying, and notes that candidate experience remains a neglected metric among employers.
Track three measures:
Application completion rate = completed applications / started applications. Break it down by device and by form step to find where people quit.
Stage drop-off = candidates who leave at a given stage / candidates who entered it. A spike after scheduling often means slow replies.
Candidate NPS or CSAT: survey candidates after key stages, including after the screen, interview and decision. Survey rejected candidates too, since they may apply again or become customers.
Sample consistently: send the survey to every candidate at a fixed stage rather than cherry-picking happy ones, and keep it concise.
Quick fixes that tend to cut drop-off:
Make the application mobile-friendly and shorten it
Offer self-scheduling so candidates can book promptly
Write role descriptions that state pay range, location and must-haves plainly
Send status updates at each stage, including rejections
For more on the reputational side, read our guide to how technology shapes candidate experience.
Turning metrics into practice: a Talent Architect pilot plan
SHRM’s analysis describes a group it calls Talent Architects: teams that shift from tracking activity toward evidence-based outcomes. Their habits are practical. They define the behaviors that predict success in a role, they keep feedback cycles short, and they refine measurement as they learn.
You can copy that approach with a three-step pilot:
Select roles. Pick two or three roles with enough hiring volume to produce data, such as a high-turnover support role and a mid-level technical role.
Define success criteria. Write down what good looks like at 6 and 12 months for each role: performance expectations, ramp time targets and the manager survey questions.
Collect and iterate. Gather 6-month and 12-month data, compare it to the sourcing channel and the interview scorecard, then adjust your process and measure again.
Watch these KPIs through the pilot:
Quality-of-hire composite by role
Early turnover at 6 and 12 months
Interview-to-offer ratio and offer acceptance rate
Time per stage, to confirm that better quality did not cost you speed
SHRM reports that Talent Architects measure quality of hire almost twice as often as average teams, and that measurement discipline is linked to better hiring outcomes.
Keep expectations realistic. Disciplined measurement takes time to show results, but it can give you evidence to retire weak channels, tighten interview scorecards and have fact-based conversations with hiring managers.
Recruiter activity metrics: calls made, emails sent, interviews scheduled
Activity metrics count effort: calls made, emails and messages sent, profiles reviewed, screens completed, interviews scheduled. They are easy to collect and easy to misuse. Their legitimate job is diagnostic. When outcomes dip, activity data helps you see whether the cause is too little outreach, a slow response to applicants, or a pipeline that was never filled.
Treat activity as a leading indicator, never a goal. A recruiter who sends many messages to poorly matched profiles is busy, not effective. The useful companion is a response and conversion rate: replies divided by messages sent, and screens divided by replies. If volume is high and replies are low, the targeting or the message needs work, not more sending.
Interviews scheduled deserves special care. It is the one activity metric that sits close to an outcome, because scheduled interviews turn into submittals and offers. Pair it with time-to-schedule and interview show-up rate to see whether scheduling is efficient and candidates are engaged.
Set healthy limits. Use activity data in coaching conversations and capacity planning, not in individual ranking. Review it weekly alongside flow metrics, and always read it next to submittal-to-interview ratio and early turnover. When effort and outcome move together, you have a reliable picture. When they diverge, the divergence is the story worth investigating.
Pipeline velocity and funnel conversion rates through different stages
Pipeline velocity describes how fast candidates move through your funnel and how many survive each step. Funnel conversion rates describe the survival part: the share of candidates who advance from one stage to the next. Together they show both speed and leakage.
A basic funnel runs from applied to screened to submitted to interviewed to offered to accepted to started. For each step, compute the conversion rate as the number who advanced divided by the number who entered. Then attach the median days spent in that stage. A stage with low conversion and long duration is your first target for redesign.
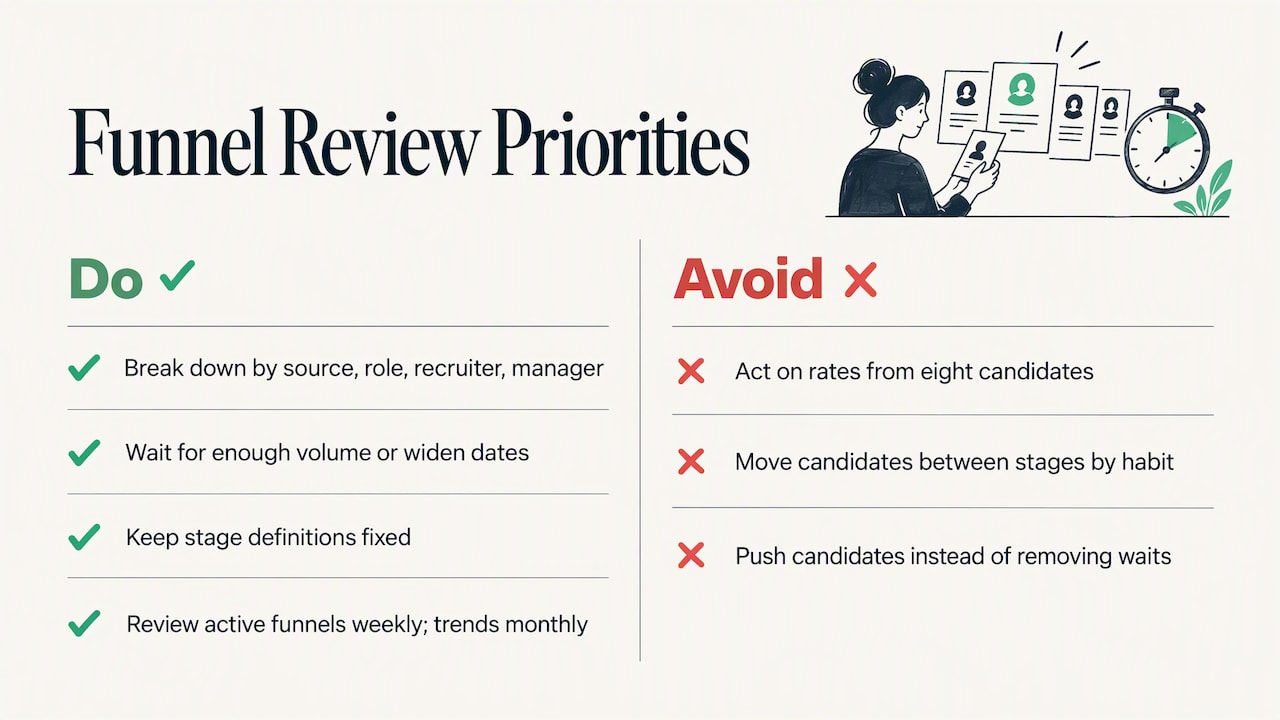
Read the funnel by segment, not only in total. Break it down by source channel, role family, recruiter and hiring manager. A channel that fills the top with the funnel but converts poorly at the screen is costing your team time. A role family that converts well until the offer stage points at compensation or competing offers.
Be careful with small samples. A conversion rate calculated from eight candidates will swing wildly, so wait for enough volume or widen the date range before acting. Also keep stage definitions fixed, since moving a candidate between stages by habit rather than rule will quietly corrupt the rates.
Review the funnel weekly for active requisitions and monthly for trends. Velocity improves when you remove waiting, such as delayed feedback and unanswered scheduling requests, far more often than when you push candidates harder.
Recruitment marketing metrics and employer branding impact
Recruitment marketing metrics tell you whether your employer brand attracts the right people at a reasonable cost. They sit upstream of your funnel, so they shape every metric discussed above.
Track a handful of measures:
Career site visits to application rate: how many visitors start and finish an application.
Source-of-hire mix: the share of hires from each channel, which shows where your brand pulls on its own versus where you pay for reach.
Cost per application and cost per qualified application by channel: paid spend divided by applications, then by those that pass screening.
Talent network growth and engagement: sign-ups, email open rates and returning visitors.
Offer acceptance rate: a late but telling signal of how your brand compares with competing offers.
The aim is to connect brand activity to downstream quality. A channel that delivers cheap applications but poor quality of hire is expensive in practice. Tie each source back to the quality composite and early turnover so you judge channels by the hires that stay and perform, not the clicks they generate.
Employer branding effects are slow and noisy, so avoid reading too much into a single month. Compare quarter over quarter, and pair the numbers with candidate survey comments about why people applied or declined. Candidate experience work and brand work reinforce each other: a clear, fair, responsive process becomes part of what candidates say about you, and what they say shapes who applies next.
Integrating sales CRM and recruiting metrics for a holistic performance view
For agencies and any team that wins hiring work from clients or internal customers, recruiting performance is only half the picture. The other half is how requisitions arrive, which is a sales process. Connecting CRM and recruiting data lets you see the whole chain from lead to placement.
Useful combined views include:
Client or account to requisition conversion: how many conversations become open, workable requisitions.
Requisition quality: exclusivity, fee terms and responsiveness of the client, set against fill rate and time-to-fill.
Revenue per recruiter and per requisition: placements weighted by value, read next to workload.
Pipeline coverage: open requisitions compared with qualified candidates ready to submit.
The payoff is better decisions on where to spend effort. If one client sends many requisitions but fills few because feedback is slow, your data will show it, and you can renegotiate terms or deprioritize. If a specific role family closes quickly and yields strong quality of hire, the sales team can pursue more of it.
The practical requirement is shared identifiers: the same client, contact and requisition records must exist in both systems, or the numbers will not join. That is why we built our platform with the sales pipeline and recruitment pipeline in one place; see our agency CRM for how the two connect. Whatever tools you use, agree on definitions between sales and recruiting before you build the dashboard.
Why we measure outcomes over activity
We think the industry has spent years rewarding what is easy to count. Calls, emails and submittals fill a dashboard quickly, and they make a team look busy. But busy is not the same as good. The numbers that matter, quality of hire and early turnover, arrive months after the recruiter has moved on, so they rarely appear in anyone’s weekly review.
Change that by bringing hiring managers into the loop. Retention is not a recruiting metric alone; managers shape whether a new hire stays and performs. If both sides share the 6-month and 12-month results, the conversation shifts from “how fast did you fill it” to “did it work.”
Start small. Pick two roles, define success, and measure for a year. A modest, trusted metric beats an elaborate dashboard nobody believes.
- Recruitify Team
How Recruitify helps you automate metrics, dashboards, and AI scoring
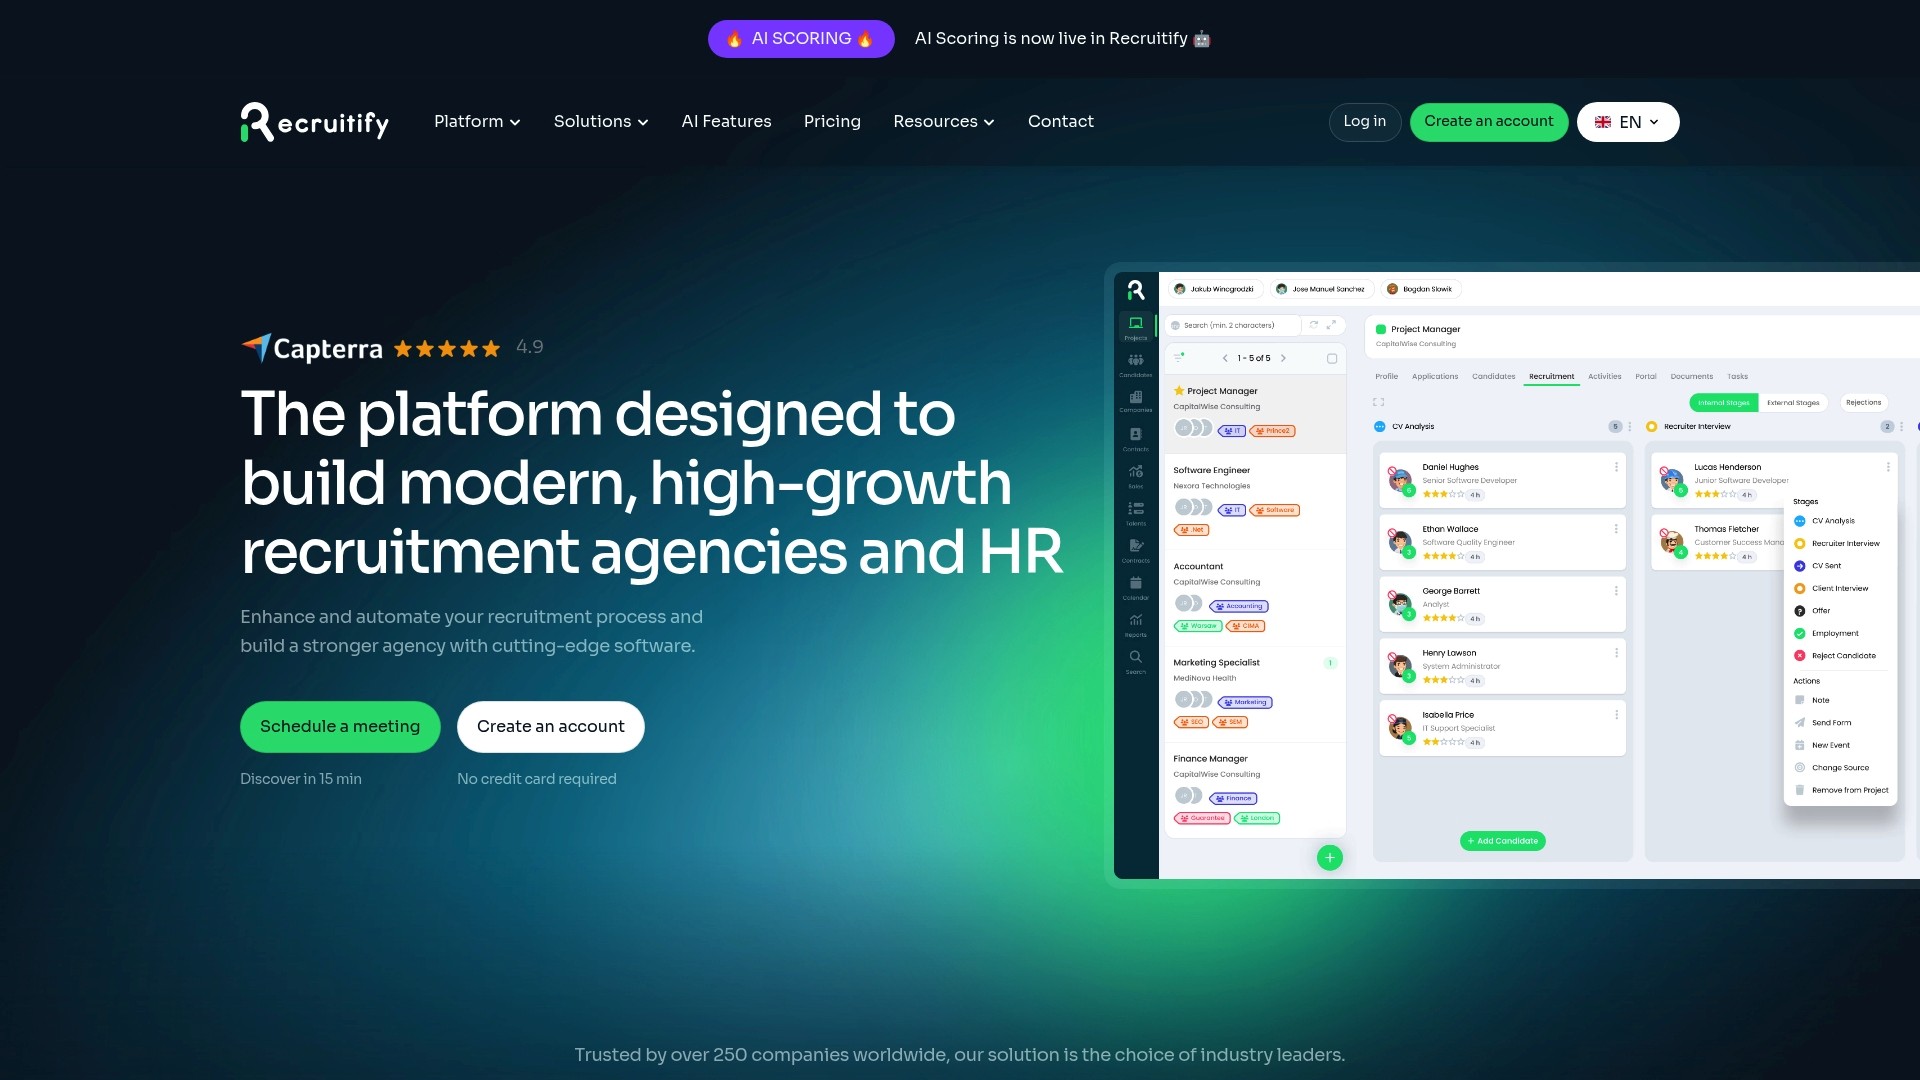
Collecting the numbers above by hand is where most measurement programs die. We built Recruitify to take that admin off your team: our platform combines an ATS, a sales CRM and contracting in one system, so stage times, ratios and pipeline data sit in a single place. Our advanced reporting turns that data into dashboards, while our AI features score applications against project requirements and parse CVs in seconds, so screening moves faster. Our automation tools handle repetitive steps between stages. See which plan fits your team on our pricing page: HR Team is 69 EUR per month per user, and Recruitment Agencies is 79 EUR per month per user.
FAQ
What key recruitment metrics should you track?
Track time-to-hire by stage, submittal-to-interview ratio, offer acceptance rate, cost per hire, early turnover and a composite quality of hire. Add candidate experience and requisitions per recruiter for a full picture. Start with the three your ATS already holds.
What are the stages of the recruitment process?
A common sequence is requisition approval, sourcing, application, screening, interviews, offer, acceptance and onboarding. Naming your own stages and fixing their definitions matters more than the exact count. Stable stages make stage-level timing and conversion rates comparable over time.
How do you measure recruiter productivity without encouraging gaming?
Use team-level targets, adjust for role complexity, and pair every volume metric with an outcome metric such as early turnover. Review unusual individual numbers in a conversation instead of treating them as a verdict.
How does candidate experience affect retention?
CIPD research reports that a positive candidate experience raises the likelihood a new hire stays by 38%. Faster scheduling, clear role descriptions and regular status updates are practical starting points.
Sources
Good tracking starts with knowing where each number lives. Set it up in this order:
Common pitfalls and their fixes:
Pro Tip: Audit a metric end to end regularly. Trace records back to the source and confirm the dashboard matches reality.
For a broader view of using analytics in hiring decisions, see our post on data-driven recruitment.
Recommended


News & Updates
Stay up-to-date with the latest innovations, features, and tips about Recruitify!
By providing your email address within the newsletter sign-up form, you confirm its processing to send marketing information regarding the Administrator’s products and services. The Administrator of your personal data processed for the abovementioned purposes is Recruitify Spółka z o.o., based in Warsaw, Poland (KRS 0000709889). For more information on the principles of personal data processing and the rights of data subjects, please check the Privacy Policy.

Last updated:
Recruiter Productivity Metrics: 3 Measures That Expose Funnel Leaks
Recruitment Process
The Recruitify Team
Track requisitions per recruiter, submittal-to-interview ratio, interviews per hire, time-to-hire by stage, a composite quality of hire, cost per hire, offer acceptance rate, early turnover, and candidate experience score. Outcomes such as quality and retention outweigh raw activity counts, a pattern SHRM and CIPD research both point toward. Recruitify supports recruitment analytics.
RecruitifySee Your Recruitment Funnel More ClearlyRecruitify brings ATS, sales CRM, and IT contracting data together, helping recruitment agencies reduce scattered information and track performance.Explore Recruitify
Key Takeaways
Organizations that focus on outcome-based recruitment metrics like quality of hire and early turnover outperform those that only track activity levels.
Point | Details |
|---|---|
Use stage-level timing | Measure time spent at each recruitment stage to identify bottlenecks and target improvements effectively. |
Prioritize outcome metrics | Track quality of hire, early turnover, and offer acceptance rate to assess real recruitment success. |
Automate data collection | Leverage recruiting platforms like Recruitify to automatically gather and analyze key performance indicators. |
Implement a pilot program | Select specific roles to measure success, refine your process, and build a goal-oriented recruitment culture. |
Align sales and recruiting efforts | Connect CRM and ATS data to optimize requisition flow, client relationships, and hiring outcomes. |
Table of Contents
Which recruiter productivity metrics belong on your dashboard today?
Speed metrics: time-to-hire, time-to-fill, and stage-level breakdown
Quality metrics: building a usable quality-of-hire composite
Productivity metrics: requisitions per recruiter, submittal-to-interview ratios, and placements
Cost metrics: calculating cost per hire alongside quality and speed
Candidate experience metrics: completion rate, drop-off, and candidate NPS
Turning metrics into practice: a Talent Architect pilot plan
Recruiter activity metrics: calls made, emails sent, interviews scheduled
Pipeline velocity and funnel conversion rates through different stages
Recruitment marketing metrics and employer branding impact
Integrating sales CRM and recruiting metrics for a holistic performance view
Why we measure outcomes over activity
How Recruitify helps you automate metrics, dashboards, and AI scoring
FAQ
Sources
Which recruiter productivity metrics belong on your dashboard today?
Start with a short list you can copy into a measurement template. Each metric below carries a definition, a formula, a data source, a type (outcome or activity) and a review cadence.
Requisitions per recruiter (activity, monthly): open requisitions divided by active recruiters. Source: ATS.
Submittal-to-interview ratio (outcome, weekly): candidates interviewed divided by candidates submitted. Source: ATS.
Interviews per hire (outcome, monthly): total interviews held divided by hires made. Source: ATS and calendar data.
Time-to-hire and time per stage (outcome, weekly): days from application or first contact to accepted offer, split by stage. Source: ATS timestamps.
Quality of hire (outcome, quarterly): a weighted composite of performance, retention, manager satisfaction and ramp time. Source: HRIS and manager surveys.
Cost per hire (outcome, quarterly): total recruiting spend divided by hires. Source: finance and ATS.
Offer acceptance rate (outcome, monthly): offers accepted divided by offers extended. Source: ATS.
Early turnover (outcome, quarterly): new hires who leave within 6 or 12 months divided by hires in that cohort. Source: HRIS.
Candidate experience score (outcome, monthly): average rating or NPS from candidate surveys. Source: survey tool.
If you only have an hour this week, start three: time per stage, offer acceptance rate and submittal-to-interview ratio. All three come straight from ATS data you already hold, and together they show where your funnel leaks.
Speed metrics: time-to-hire, time-to-fill, and stage-level breakdown
Two terms get blended constantly. Time-to-hire counts the days from a candidate’s application (or first contact) to their accepted offer. Time-to-fill counts the days from the requisition opening to the accepted offer. Time-to-fill reflects how fast the business moves, including approvals. Time-to-hire reflects how fast your process moves once a candidate is in it.
A single blended number hides the real problem. A long average might mean sourcing is slow, or it might mean managers take too long to schedule interviews. Stage-level measurement tells you which, and it tells you whose problem it is.
Measure these five stages:
Sourcing: days from requisition open to first qualified applicant or contact.
Time-to-screen: days from application to completed recruiter screen.
Time-to-schedule: days from screen to the first scheduled interview.
Time-to-offer: days from final interview to offer extended.
Time-to-start: days from offer acceptance to the first day of work.
Take an illustrative example. A candidate applies, is screened, interviewed, receives an offer and accepts. The stage view can reveal how long scheduling took, which helps show where to look first. If the requisition opened before the applicant arrived, time-to-fill would be longer than time-to-hire.
Automation changes specific stages, not the whole line. Resume parsing and AI scoring should shorten time-to-screen. Self-scheduling should shorten time-to-schedule. If time-to-offer does not move after you automate screening, the bottleneck sits in manager decisions or approvals, and a tool will not fix it. Our guide on cutting time-to-hire walks through stage-level examples in more detail.
Review stage times weekly, because flow problems compound fast. Compare medians rather than averages, since one stalled requisition can distort a mean badly.
Pro Tip: Report the median for each stage to show your typical experience, and review unusually long cases to see where delays occur.
Quality metrics: building a usable quality-of-hire composite
Quality of hire is the metric most leaders call the most important, yet few organizations have a standardized formula for it. The practical fix is a composite that blends four signals available inside most HR systems.
Performance rating: the new hire’s most recent review score, normalized to a consistent scale.
Retention: whether the hire is still employed at the checkpoint (100 if yes, 0 if no).
Hiring manager satisfaction: a short manager survey score, normalized to a consistent scale.
Time-to-productivity: how quickly the hire reached the expected output, scored against a role-specific target.
A simple weighted formula combines performance, retention, manager satisfaction and time-to-productivity. Choose and document weights that suit your needs, since there is no single standard. Tune them to the role: for a sales role, you might raise time-to-productivity, and for a leadership role, you might raise manager satisfaction.
Run the measurement twice. A 6-month check catches early problems in fit and onboarding and lets you refine the assessment process. A 12-month check gives the fuller composite, once performance ratings and retention have had time to mean something. SHRM’s analysis describes top teams measuring at 12 months with a composite built on exactly these inputs, with 6-month checks used to adjust.
SHRM finds that Talent Architects, the most effective recruitment teams, measure quality of hire almost twice as often as average teams. Measurement discipline, not extra headcount, is what separates them.
Capture these fields in a simple spreadsheet or your ATS so the data exists when you need it:
Hire ID, role, recruiter, source channel and start date
Hiring manager name and the sourcing channel that produced the hire
6-month and 12-month performance rating
Still employed at 6 months and at 12 months (yes or no)
Manager satisfaction score at 6 and 12 months
Days to reach target productivity
Feed the results back into sourcing decisions. If hires from one channel score well below hires from another, move budget. If one hiring manager’s hires leave early more often, that is a conversation about the role and the manager, not only about the recruiter. For a worked pilot, see our post on automating quality-of-hire KPIs.
Productivity metrics: requisitions per recruiter, submittal-to-interview ratios, and placements
Requisitions per recruiter tells you workload. It does not tell you effectiveness. SHRM’s 2026 benchmarking reports that extra-large organizations saw a 67% increase in requisitions per recruiter in 2026, which shows how quickly load can climb without anyone deciding it should. A raw count also misleads: ten requisitions for warehouse roles are not equal to ten for senior engineers. Use a weighted measure that assigns higher points to hard-to-fill or senior roles.
The two ratios that reflect recruiter judgment are these:
Submittal-to-interview ratio = candidates interviewed / candidates submitted to the hiring manager. A low ratio means you send weak matches or the manager’s criteria are unclear.
Interview-to-offer ratio = offers extended / candidates interviewed. A low ratio points to misaligned expectations, a weak interview process, or a manager who cannot decide.
Interpretation matters more than the number. The number could signal poor screening, or it could signal that the manager changed the brief mid-search. Read the ratio alongside the manager’s feedback before drawing conclusions about the recruiter.
Use these metrics at the team and process level. Raw individual scorecards invite gaming: recruiters submit fewer, safer candidates to inflate ratios, or rush hires to pad placement counts. Healthy governance includes:
Adjusting for role complexity and market conditions before comparing people
Setting targets for teams, not individuals
Pairing every volume metric with an outcome metric such as early turnover
Reviewing outliers in a conversation, never as an automatic verdict
Pro Tip: If a recruiter’s ratios look unusual, check the requisition mix before the person. Role types can help explain differences in the results.
Cost metrics: calculating cost per hire alongside quality and speed
Cost per hire is simple to state and easy to get wrong. Use this sequence:
Add external costs: job advertising, agency fees, assessment tools, background checks, relocation, and sourcing subscriptions.
Add internal costs: recruiter and coordinator time (salary share), hiring manager interview time if you track it, referral bonuses, and recruiting software.
Add them together for the period.
Divide by the number of hires in the same period.
Be explicit about exclusions, such as onboarding and training costs or general HR overhead, and keep that definition fixed. A metric whose boundaries drift from quarter to quarter cannot be trended.
SHRM’s 2026 benchmarking draws on data from over 4,600 organizations and tracks cost per hire and time-to-fill trends across organization sizes. Use it to see where your figures sit relative to peers of your size.
Watch out for the trap of optimizing cost alone. Cutting spend lowers cost per hire, but it can also raise early turnover, which pushes the real price of each hire up. A cheap hire who leaves in five months is the most expensive outcome on your dashboard. Always read cost beside quality of hire and early turnover.
Awareness of return on investment is thin as well: CIPD’s resourcing and talent planning survey found that only 19% of organizations measure recruitment ROI. If you track cost against quality, you are ahead of most. Our piece on maximizing ROI from recruitment software covers how to attach savings to specific process changes.
Candidate experience metrics: completion rate, drop-off, and candidate NPS
Candidate experience is a measurable input, and it may relate to retention. CIPD research reports a positive link between candidate experience and the likelihood of a new hire staying, and notes that candidate experience remains a neglected metric among employers.
Track three measures:
Application completion rate = completed applications / started applications. Break it down by device and by form step to find where people quit.
Stage drop-off = candidates who leave at a given stage / candidates who entered it. A spike after scheduling often means slow replies.
Candidate NPS or CSAT: survey candidates after key stages, including after the screen, interview and decision. Survey rejected candidates too, since they may apply again or become customers.
Sample consistently: send the survey to every candidate at a fixed stage rather than cherry-picking happy ones, and keep it concise.
Quick fixes that tend to cut drop-off:
Make the application mobile-friendly and shorten it
Offer self-scheduling so candidates can book promptly
Write role descriptions that state pay range, location and must-haves plainly
Send status updates at each stage, including rejections
For more on the reputational side, read our guide to how technology shapes candidate experience.
Turning metrics into practice: a Talent Architect pilot plan
SHRM’s analysis describes a group it calls Talent Architects: teams that shift from tracking activity toward evidence-based outcomes. Their habits are practical. They define the behaviors that predict success in a role, they keep feedback cycles short, and they refine measurement as they learn.
You can copy that approach with a three-step pilot:
Select roles. Pick two or three roles with enough hiring volume to produce data, such as a high-turnover support role and a mid-level technical role.
Define success criteria. Write down what good looks like at 6 and 12 months for each role: performance expectations, ramp time targets and the manager survey questions.
Collect and iterate. Gather 6-month and 12-month data, compare it to the sourcing channel and the interview scorecard, then adjust your process and measure again.
Watch these KPIs through the pilot:
Quality-of-hire composite by role
Early turnover at 6 and 12 months
Interview-to-offer ratio and offer acceptance rate
Time per stage, to confirm that better quality did not cost you speed
SHRM reports that Talent Architects measure quality of hire almost twice as often as average teams, and that measurement discipline is linked to better hiring outcomes.
Keep expectations realistic. Disciplined measurement takes time to show results, but it can give you evidence to retire weak channels, tighten interview scorecards and have fact-based conversations with hiring managers.
Recruiter activity metrics: calls made, emails sent, interviews scheduled
Activity metrics count effort: calls made, emails and messages sent, profiles reviewed, screens completed, interviews scheduled. They are easy to collect and easy to misuse. Their legitimate job is diagnostic. When outcomes dip, activity data helps you see whether the cause is too little outreach, a slow response to applicants, or a pipeline that was never filled.
Treat activity as a leading indicator, never a goal. A recruiter who sends many messages to poorly matched profiles is busy, not effective. The useful companion is a response and conversion rate: replies divided by messages sent, and screens divided by replies. If volume is high and replies are low, the targeting or the message needs work, not more sending.
Interviews scheduled deserves special care. It is the one activity metric that sits close to an outcome, because scheduled interviews turn into submittals and offers. Pair it with time-to-schedule and interview show-up rate to see whether scheduling is efficient and candidates are engaged.
Set healthy limits. Use activity data in coaching conversations and capacity planning, not in individual ranking. Review it weekly alongside flow metrics, and always read it next to submittal-to-interview ratio and early turnover. When effort and outcome move together, you have a reliable picture. When they diverge, the divergence is the story worth investigating.
Pipeline velocity and funnel conversion rates through different stages
Pipeline velocity describes how fast candidates move through your funnel and how many survive each step. Funnel conversion rates describe the survival part: the share of candidates who advance from one stage to the next. Together they show both speed and leakage.
A basic funnel runs from applied to screened to submitted to interviewed to offered to accepted to started. For each step, compute the conversion rate as the number who advanced divided by the number who entered. Then attach the median days spent in that stage. A stage with low conversion and long duration is your first target for redesign.
Read the funnel by segment, not only in total. Break it down by source channel, role family, recruiter and hiring manager. A channel that fills the top with the funnel but converts poorly at the screen is costing your team time. A role family that converts well until the offer stage points at compensation or competing offers.
Be careful with small samples. A conversion rate calculated from eight candidates will swing wildly, so wait for enough volume or widen the date range before acting. Also keep stage definitions fixed, since moving a candidate between stages by habit rather than rule will quietly corrupt the rates.
Review the funnel weekly for active requisitions and monthly for trends. Velocity improves when you remove waiting, such as delayed feedback and unanswered scheduling requests, far more often than when you push candidates harder.
Recruitment marketing metrics and employer branding impact
Recruitment marketing metrics tell you whether your employer brand attracts the right people at a reasonable cost. They sit upstream of your funnel, so they shape every metric discussed above.
Track a handful of measures:
Career site visits to application rate: how many visitors start and finish an application.
Source-of-hire mix: the share of hires from each channel, which shows where your brand pulls on its own versus where you pay for reach.
Cost per application and cost per qualified application by channel: paid spend divided by applications, then by those that pass screening.
Talent network growth and engagement: sign-ups, email open rates and returning visitors.
Offer acceptance rate: a late but telling signal of how your brand compares with competing offers.
The aim is to connect brand activity to downstream quality. A channel that delivers cheap applications but poor quality of hire is expensive in practice. Tie each source back to the quality composite and early turnover so you judge channels by the hires that stay and perform, not the clicks they generate.
Employer branding effects are slow and noisy, so avoid reading too much into a single month. Compare quarter over quarter, and pair the numbers with candidate survey comments about why people applied or declined. Candidate experience work and brand work reinforce each other: a clear, fair, responsive process becomes part of what candidates say about you, and what they say shapes who applies next.
Integrating sales CRM and recruiting metrics for a holistic performance view
For agencies and any team that wins hiring work from clients or internal customers, recruiting performance is only half the picture. The other half is how requisitions arrive, which is a sales process. Connecting CRM and recruiting data lets you see the whole chain from lead to placement.
Useful combined views include:
Client or account to requisition conversion: how many conversations become open, workable requisitions.
Requisition quality: exclusivity, fee terms and responsiveness of the client, set against fill rate and time-to-fill.
Revenue per recruiter and per requisition: placements weighted by value, read next to workload.
Pipeline coverage: open requisitions compared with qualified candidates ready to submit.
The payoff is better decisions on where to spend effort. If one client sends many requisitions but fills few because feedback is slow, your data will show it, and you can renegotiate terms or deprioritize. If a specific role family closes quickly and yields strong quality of hire, the sales team can pursue more of it.
The practical requirement is shared identifiers: the same client, contact and requisition records must exist in both systems, or the numbers will not join. That is why we built our platform with the sales pipeline and recruitment pipeline in one place; see our agency CRM for how the two connect. Whatever tools you use, agree on definitions between sales and recruiting before you build the dashboard.
Why we measure outcomes over activity
We think the industry has spent years rewarding what is easy to count. Calls, emails and submittals fill a dashboard quickly, and they make a team look busy. But busy is not the same as good. The numbers that matter, quality of hire and early turnover, arrive months after the recruiter has moved on, so they rarely appear in anyone’s weekly review.
Change that by bringing hiring managers into the loop. Retention is not a recruiting metric alone; managers shape whether a new hire stays and performs. If both sides share the 6-month and 12-month results, the conversation shifts from “how fast did you fill it” to “did it work.”
Start small. Pick two roles, define success, and measure for a year. A modest, trusted metric beats an elaborate dashboard nobody believes.
- Recruitify Team
How Recruitify helps you automate metrics, dashboards, and AI scoring
Collecting the numbers above by hand is where most measurement programs die. We built Recruitify to take that admin off your team: our platform combines an ATS, a sales CRM and contracting in one system, so stage times, ratios and pipeline data sit in a single place. Our advanced reporting turns that data into dashboards, while our AI features score applications against project requirements and parse CVs in seconds, so screening moves faster. Our automation tools handle repetitive steps between stages. See which plan fits your team on our pricing page: HR Team is 69 EUR per month per user, and Recruitment Agencies is 79 EUR per month per user.
FAQ
What key recruitment metrics should you track?
Track time-to-hire by stage, submittal-to-interview ratio, offer acceptance rate, cost per hire, early turnover and a composite quality of hire. Add candidate experience and requisitions per recruiter for a full picture. Start with the three your ATS already holds.
What are the stages of the recruitment process?
A common sequence is requisition approval, sourcing, application, screening, interviews, offer, acceptance and onboarding. Naming your own stages and fixing their definitions matters more than the exact count. Stable stages make stage-level timing and conversion rates comparable over time.
How do you measure recruiter productivity without encouraging gaming?
Use team-level targets, adjust for role complexity, and pair every volume metric with an outcome metric such as early turnover. Review unusual individual numbers in a conversation instead of treating them as a verdict.
How does candidate experience affect retention?
CIPD research reports that a positive candidate experience raises the likelihood a new hire stays by 38%. Faster scheduling, clear role descriptions and regular status updates are practical starting points.
Sources
Good tracking starts with knowing where each number lives. Set it up in this order:
Common pitfalls and their fixes:
Pro Tip: Audit a metric end to end regularly. Trace records back to the source and confirm the dashboard matches reality.
For a broader view of using analytics in hiring decisions, see our post on data-driven recruitment.
Recommended
News & Updates
Stay up-to-date with the latest innovations, features, and tips about Recruitify!
By providing your email address within the newsletter sign-up form, you confirm its processing to send marketing information regarding the Administrator’s products and services. The Administrator of your personal data processed for the abovementioned purposes is Recruitify Spółka z o.o., based in Warsaw, Poland (KRS 0000709889). For more information on the principles of personal data processing and the rights of data subjects, please check the Privacy Policy.

Discover More

Applicant Tracking System
Contractor Onboarding Checklist for IT Staffing Agencies
A contractor onboarding checklist for agencies and HR teams: classification, US tax forms, GDPR, least-privilege access and gates that stop work before approval.
20 Oct 2026
Discover More

Acquiring Talent
Boolean Search Strings: Operators, Examples and Templates
Learn how to write Boolean search strings for recruiting: operators, LinkedIn and Google X-ray examples, developer templates and mistakes to avoid.
19 Oct 2026
Discover More

Acquiring Talent
Recruitment Process Mapping for Recruiters: Fix Handoffs With SLAs
Map hiring handoffs, assign clear SLAs, and apply APQC's recommended recruiting KPIs to find delays, reduce candidate drop off, and keep the process current.
17 Oct 2026
Discover More
Applicant Tracking System
Contractor Onboarding Checklist for IT Staffing Agencies
A contractor onboarding checklist for agencies and HR teams: classification, US tax forms, GDPR, least-privilege access and gates that stop work before approval.
20 Oct 2026
Discover More
Acquiring Talent
Boolean Search Strings: Operators, Examples and Templates
Learn how to write Boolean search strings for recruiting: operators, LinkedIn and Google X-ray examples, developer templates and mistakes to avoid.
19 Oct 2026
Discover More